

Key Takeaways
- U.S. colleges enrolled 19.28 million undergraduate students in 2024.
- Women comprise 59.1% of undergraduates, while men comprise 40.9%.
- White undergraduates represent 40%; Hispanic students account for 19%, reflecting shifting patterns in college diversity across regions.
- About 65% of students are under the age of 24.
- International students total roughly 1.06 million nationwide.
For many years, colleges and postsecondary institutions have spoken about diversity in higher education as a core value. The statistics show movement: students of color make up approximately 46% of those enrolled, and women outnumber men both in undergraduate and graduate classrooms. Yet, the picture looks uneven once you look beyond the surface. Completion rates decline in several fields where support systems are underdeveloped and debt patterns amplify the gap, especially for underrepresented and underserved communities that face greater financial hardships.
This article shares current data and examines the shifting landscape of higher education. For students working on papers or research related to this topic, expert assistance is available through professional college essay writers at EssayPro.

EssayPro Brings You Writers Who Think Like Scholars
Assignments gain a stronger structure and clearer arguments with the support of real experts.

Overview of Diversity in Higher Education Statistics
Recent studies provide detailed statistics on the diversity ratio in colleges, showing who attends college today nationally. Here’s a detailed overview:
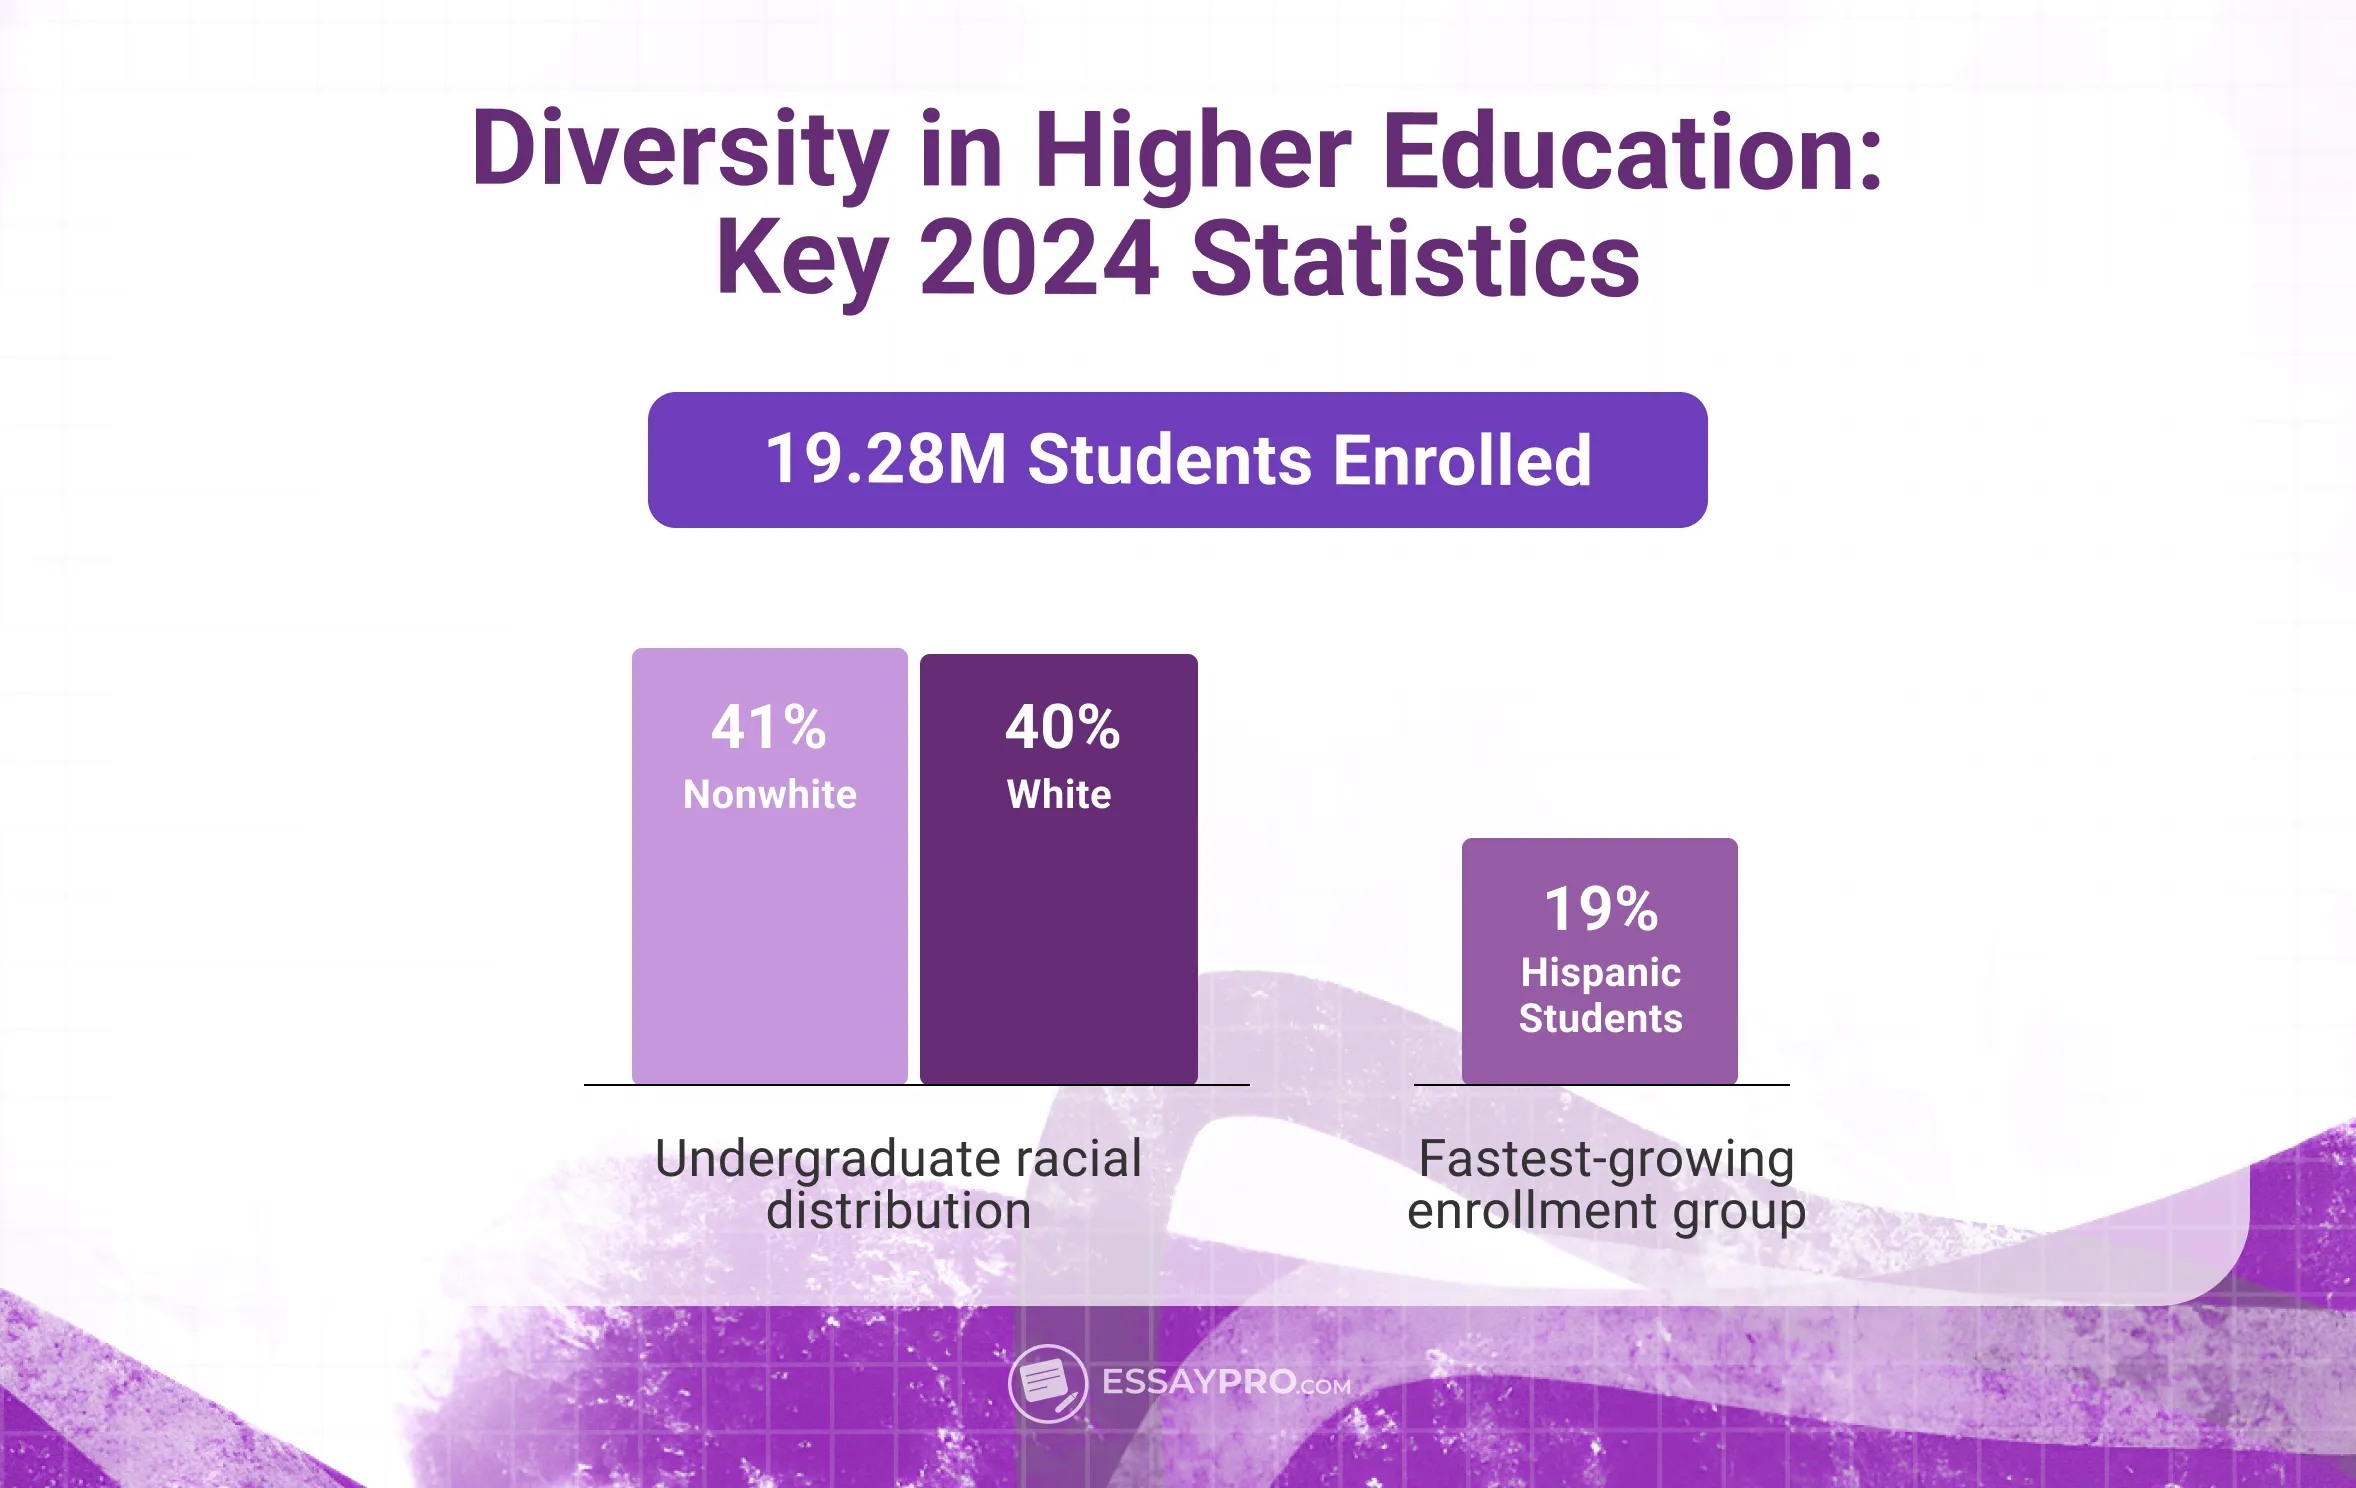
- In 2024, 19.28 million undergraduate students were enrolled in colleges, an 8.43% decrease from 21.0 million undergraduates in 2010.
- Among undergraduates, 59.1% are women and 40.9% are men.
- White students make up 40% of the total undergraduate population, followed by Hispanic or Latino students (19%).
- College students are mostly young adults. Around 26.84% are 18-19 years old, and 38.52% are 20-24.
- The United States hosted approximately 1.06 million international students in the 2022-23 academic year, representing 5.69% of the total enrollment.
- In 2022, 72 percent of faculty were White, specifically 35 percent white women and 37 percent white men;
Historical Overview of Diversity in U.S. College Enrollment
Diversity in higher education has evolved over the years. Below, you’ll find how higher education diversity trends have changed from the 1970s to the 2020s.
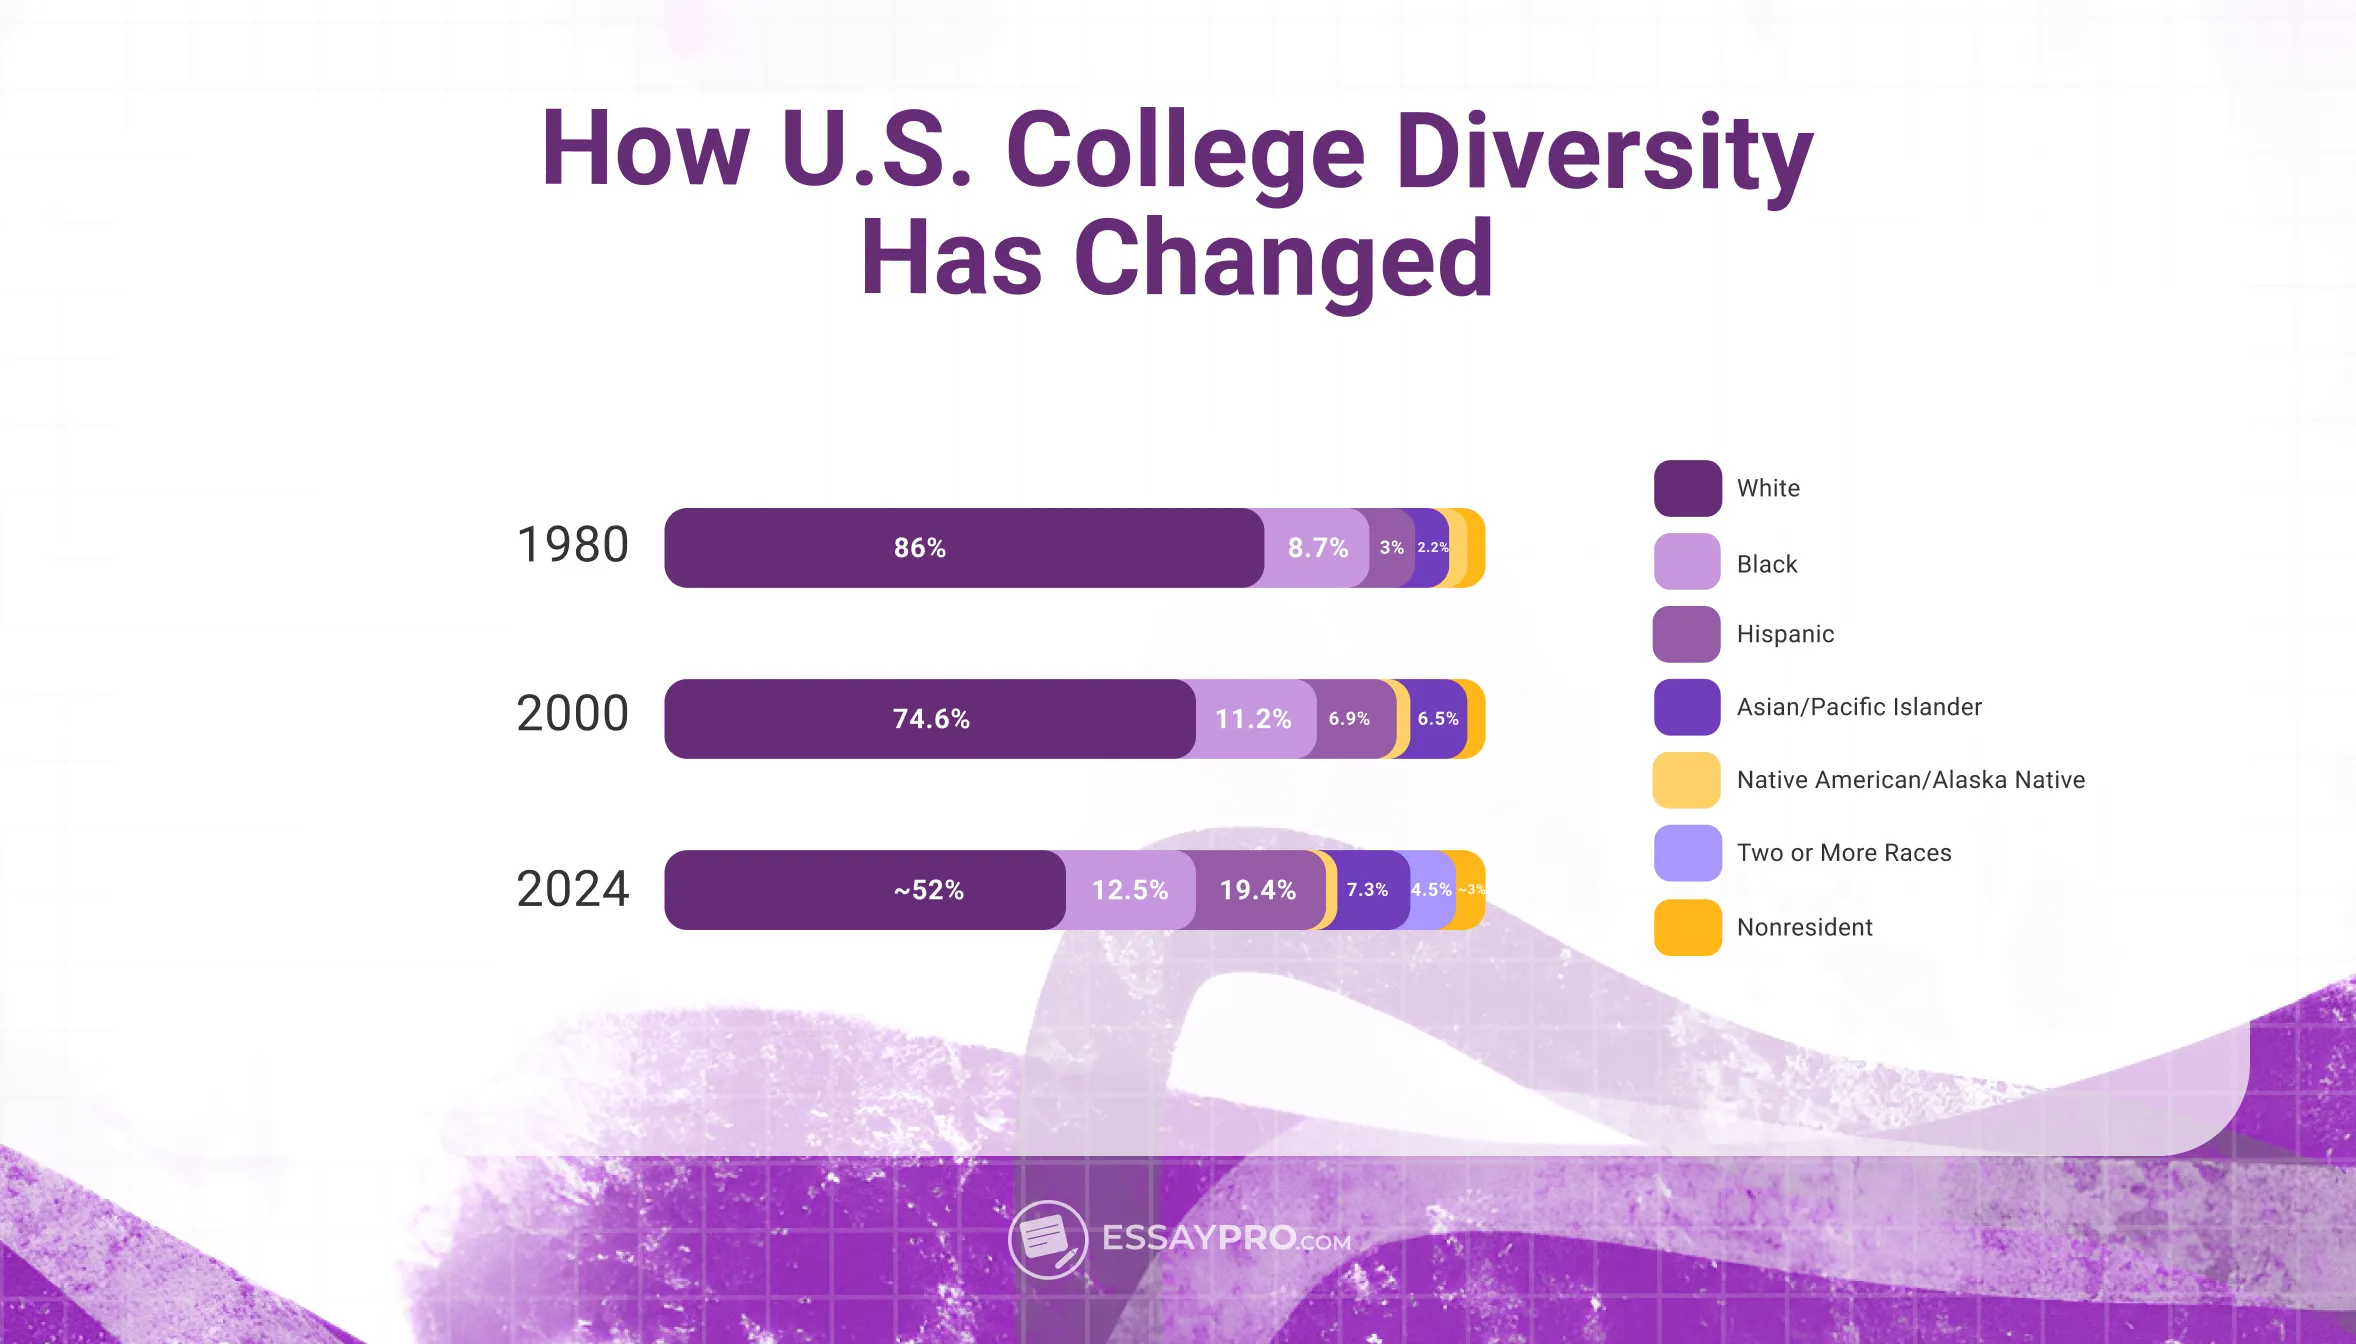
- In the mid-1970s, more than 80 percent of college students were white. The white share has been decreasing over time and is now approaching 50 percent of all students enrolled in colleges.
- In 1976, non-white racial and ethnic groups comprised approximately 15% of college enrollment. In 2023, this group was almost half of the total enrollment.
- The highest growth is seen in Hispanic college students. Their enrollment has increased multiple times, owing not only to demographic changes but also to greater access to colleges.
- Asian and Pacific Islander college students have demonstrated consistent growth over the past few decades, comprising a substantial portion of the diverse student bodies.
- The Black student population grew from the 1980s to the 1990s, reached its peak (13%) around 2010, and has remained stable since then.
- The enrollment of American Indian and Alaska Native students remained low and relatively unchanged, accounting for less than 1% of the total throughout the entire period.
These shifts appear across institutions of every type, including the ones we’ve discussed in our article on the hardest colleges to get into.
Demographic Landscape of Diversity in Higher Education
In the following sections, we will summarize diversity in colleges in terms of demographic factors, including race/ethnicity, gender, age, and school type.
Racial Diversity
When you look at the numbers year by year, the first thing that stands out is how the whole system has shrunk slightly. The decline among White students is the most noticeable change, with more than a million fewer White students enrolled in 2024 compared to 2019.
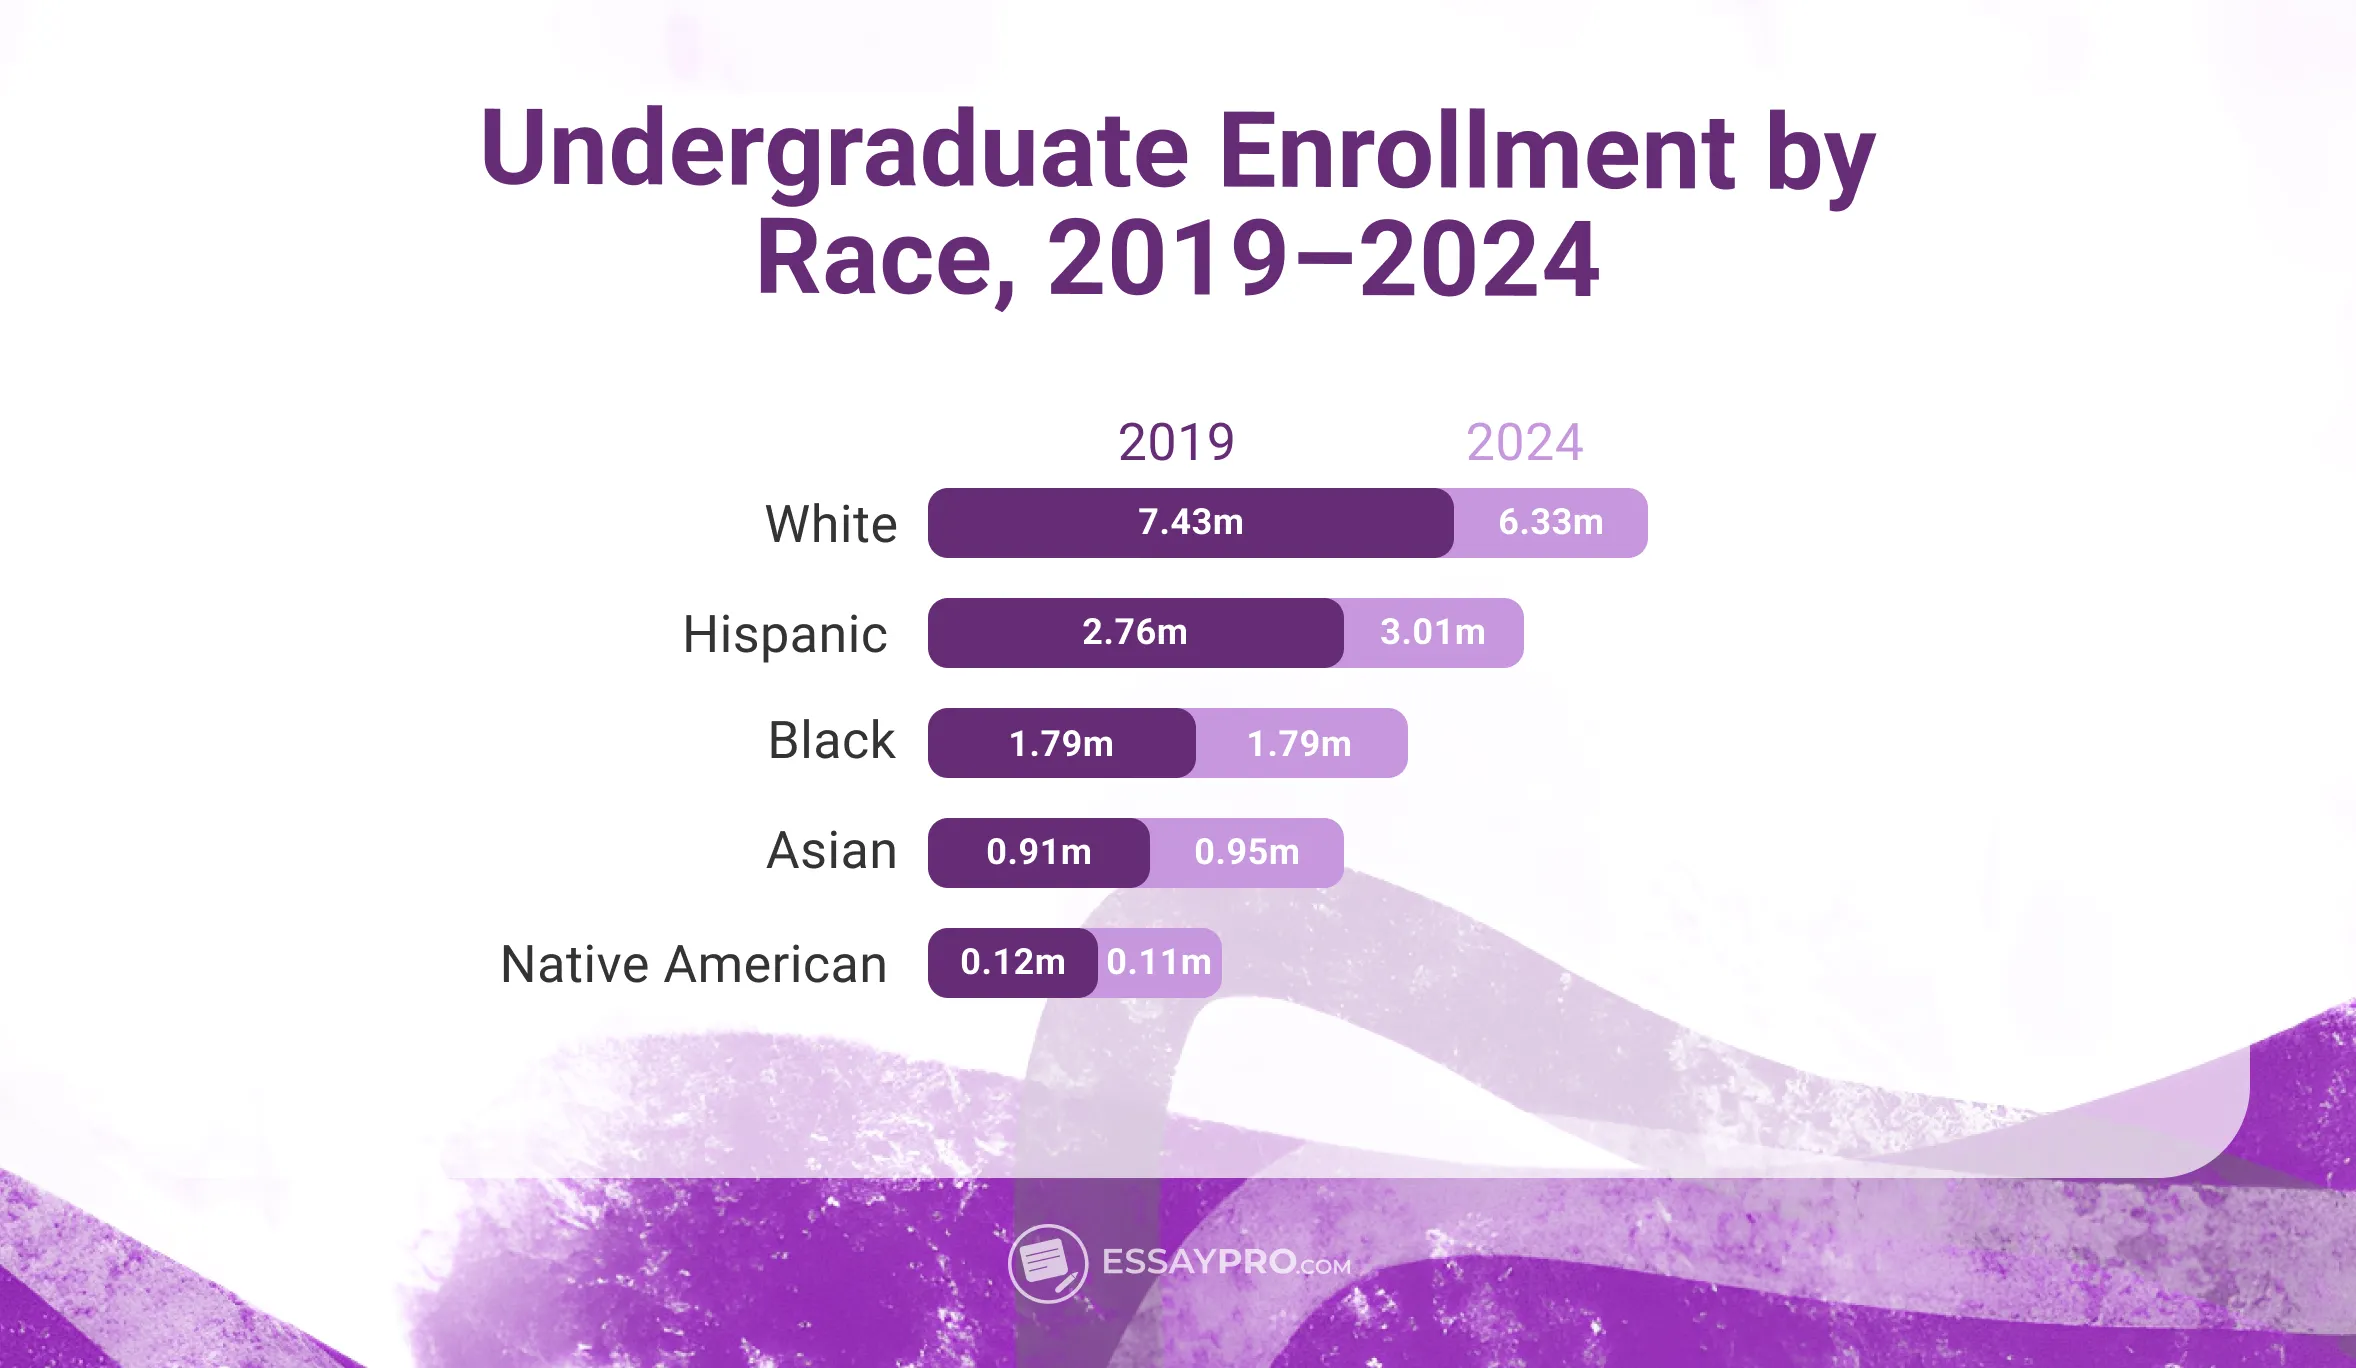
Hispanic and Latino/a enrollment has increased by a few hundred thousand students over the past five years. Asian enrollment follows a similar upward path, just at a slower pace.
Black student numbers shift a bit from year to year, but when you look at the starting point and the ending point, they’re neither shrinking nor expanding, which has its own implications when compared with the growth happening elsewhere.
The enrollment of Native American and Alaska Native students fell by more than 12%, and because their total numbers were already small, the decline feels much more significant.
Diversity by School Type
Different types of colleges attract different kinds of students. Because admission standards are strict and costs are high, private, nonprofit four-year universities tend to have:
- A higher percentage of White students (45% in 2024)
- More international students
- Fewer first-generation and low-income students
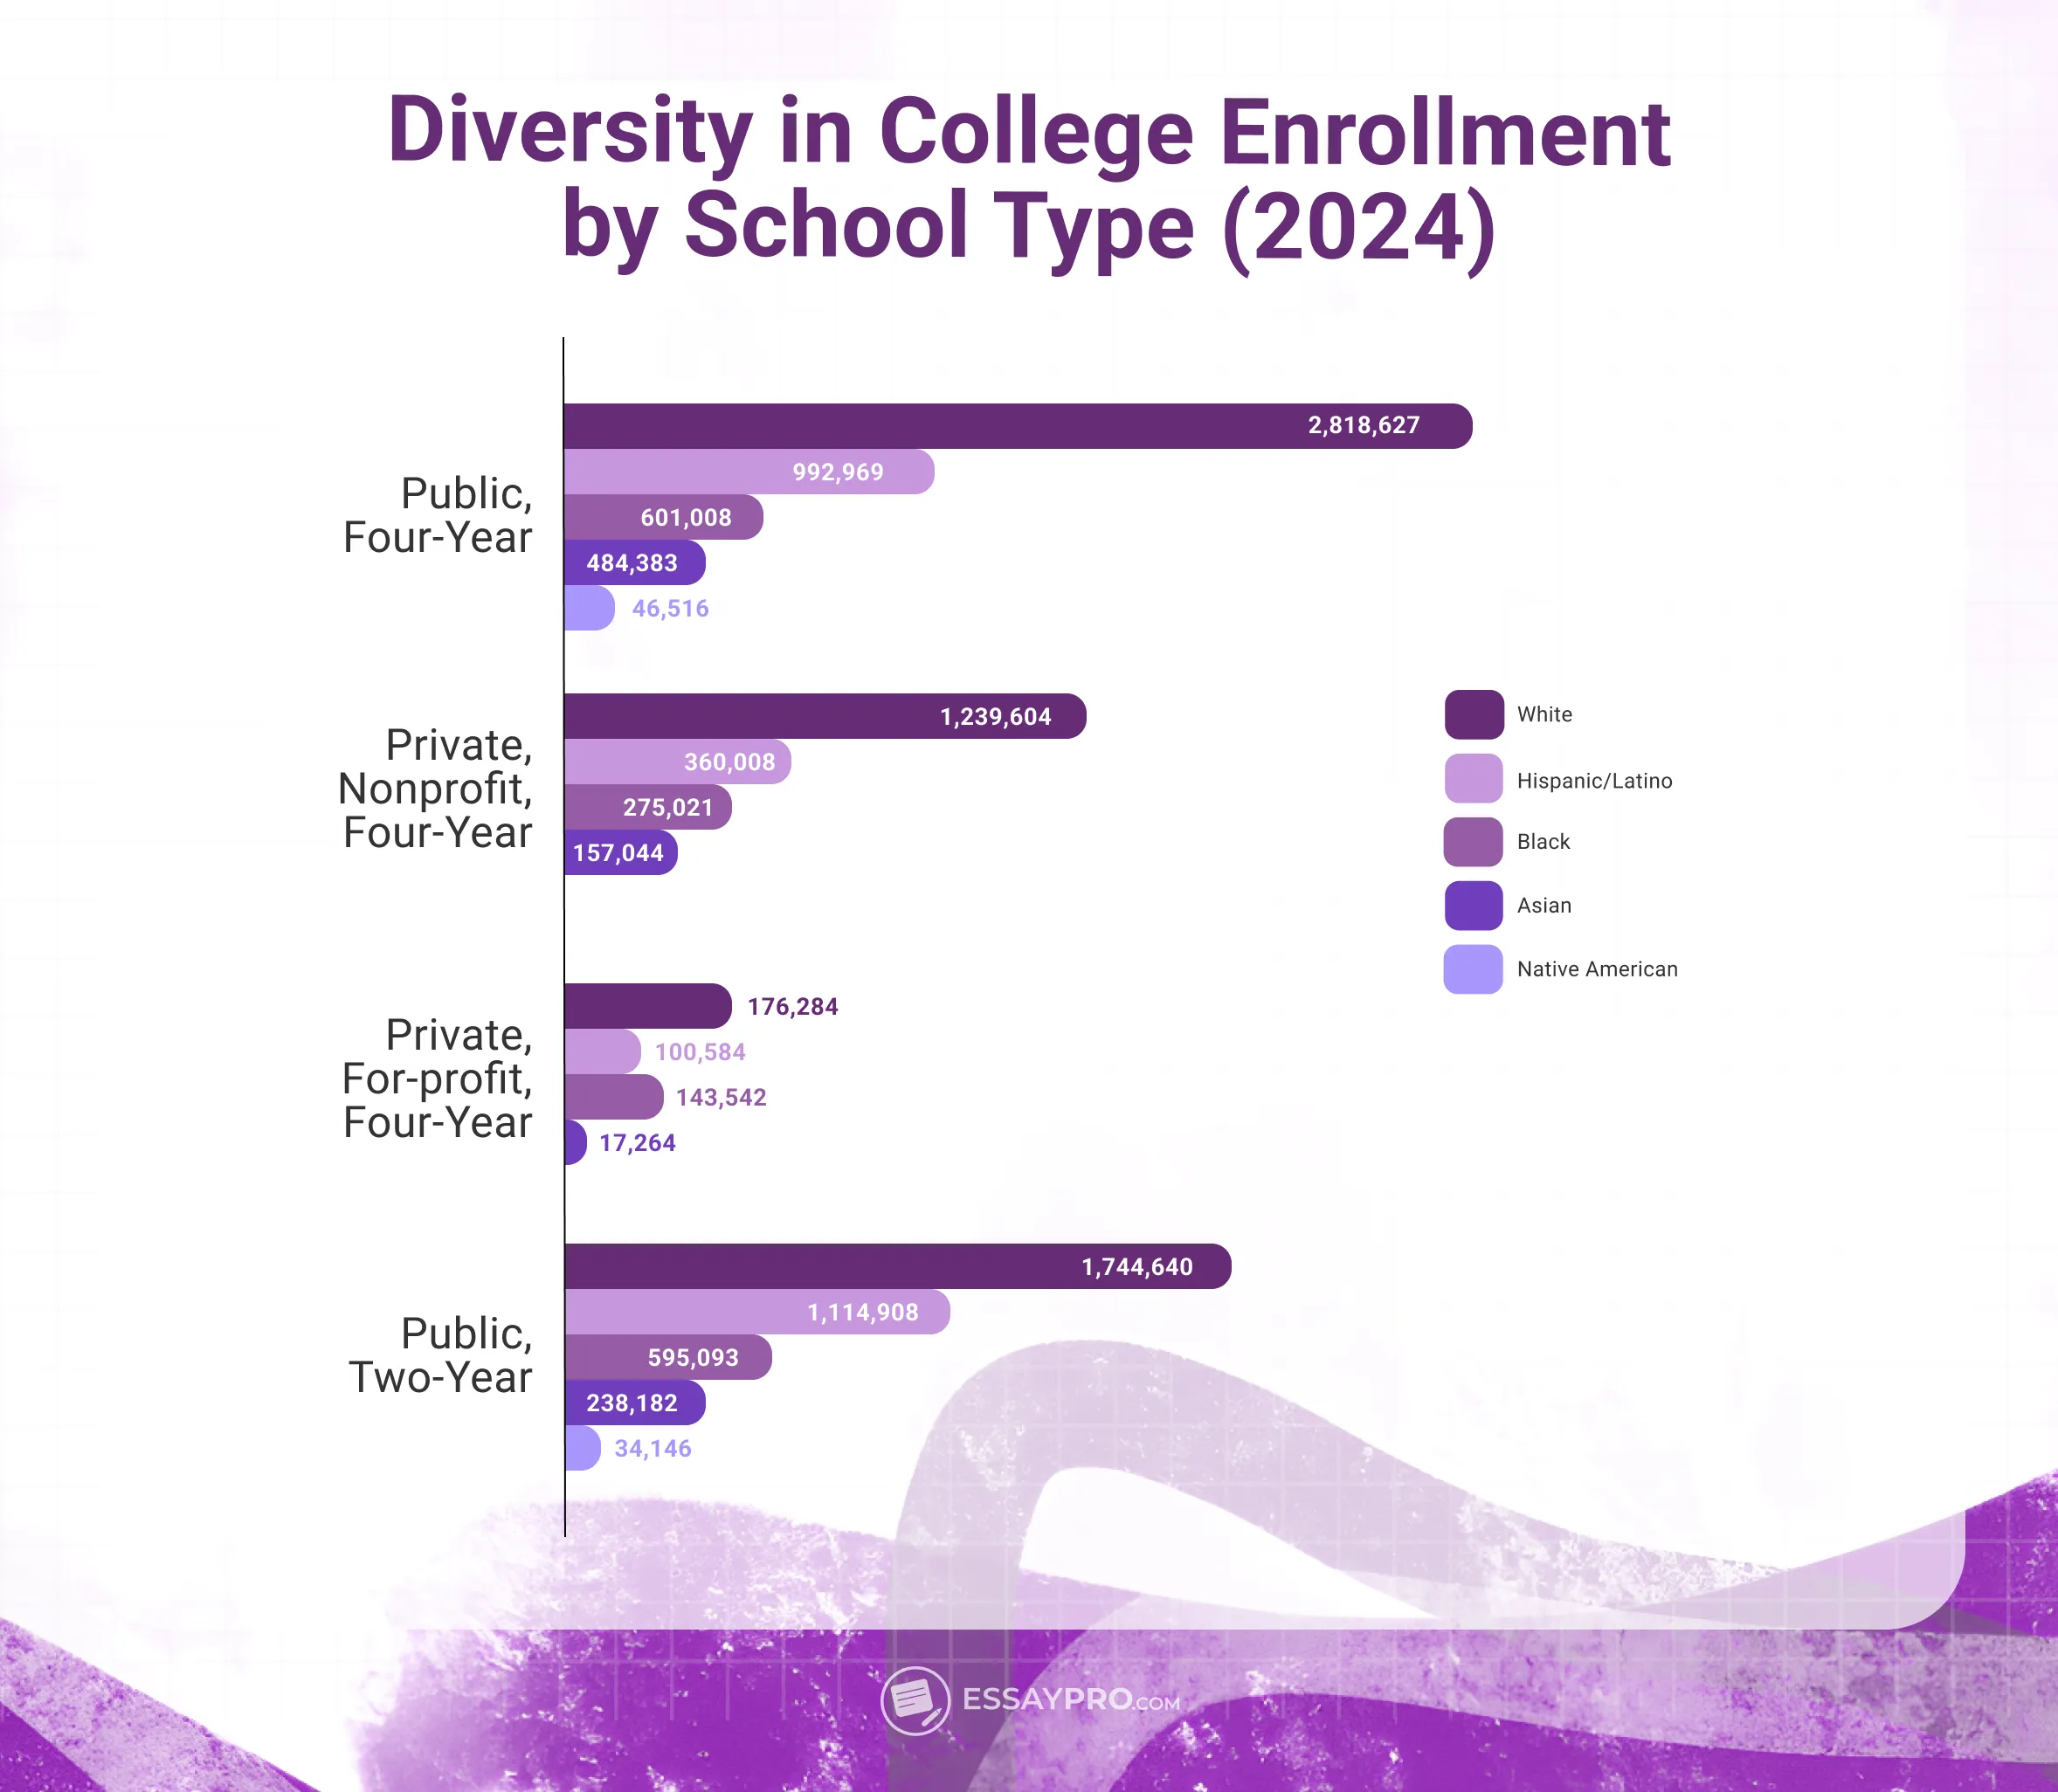
For-profit colleges attract low-income and minority students because these institutions have relatively flexible schedules and short programs. However, that diversity comes with a trade-off: lower overall graduation rates.
Age Diversity
Age is one of the most telling markers of who colleges actually serve. When we examine enrollment patterns closely, it becomes clear that the system is no longer built around a single 'typical' student. Instead, there are multiple age groups moving through higher education for very different reasons.
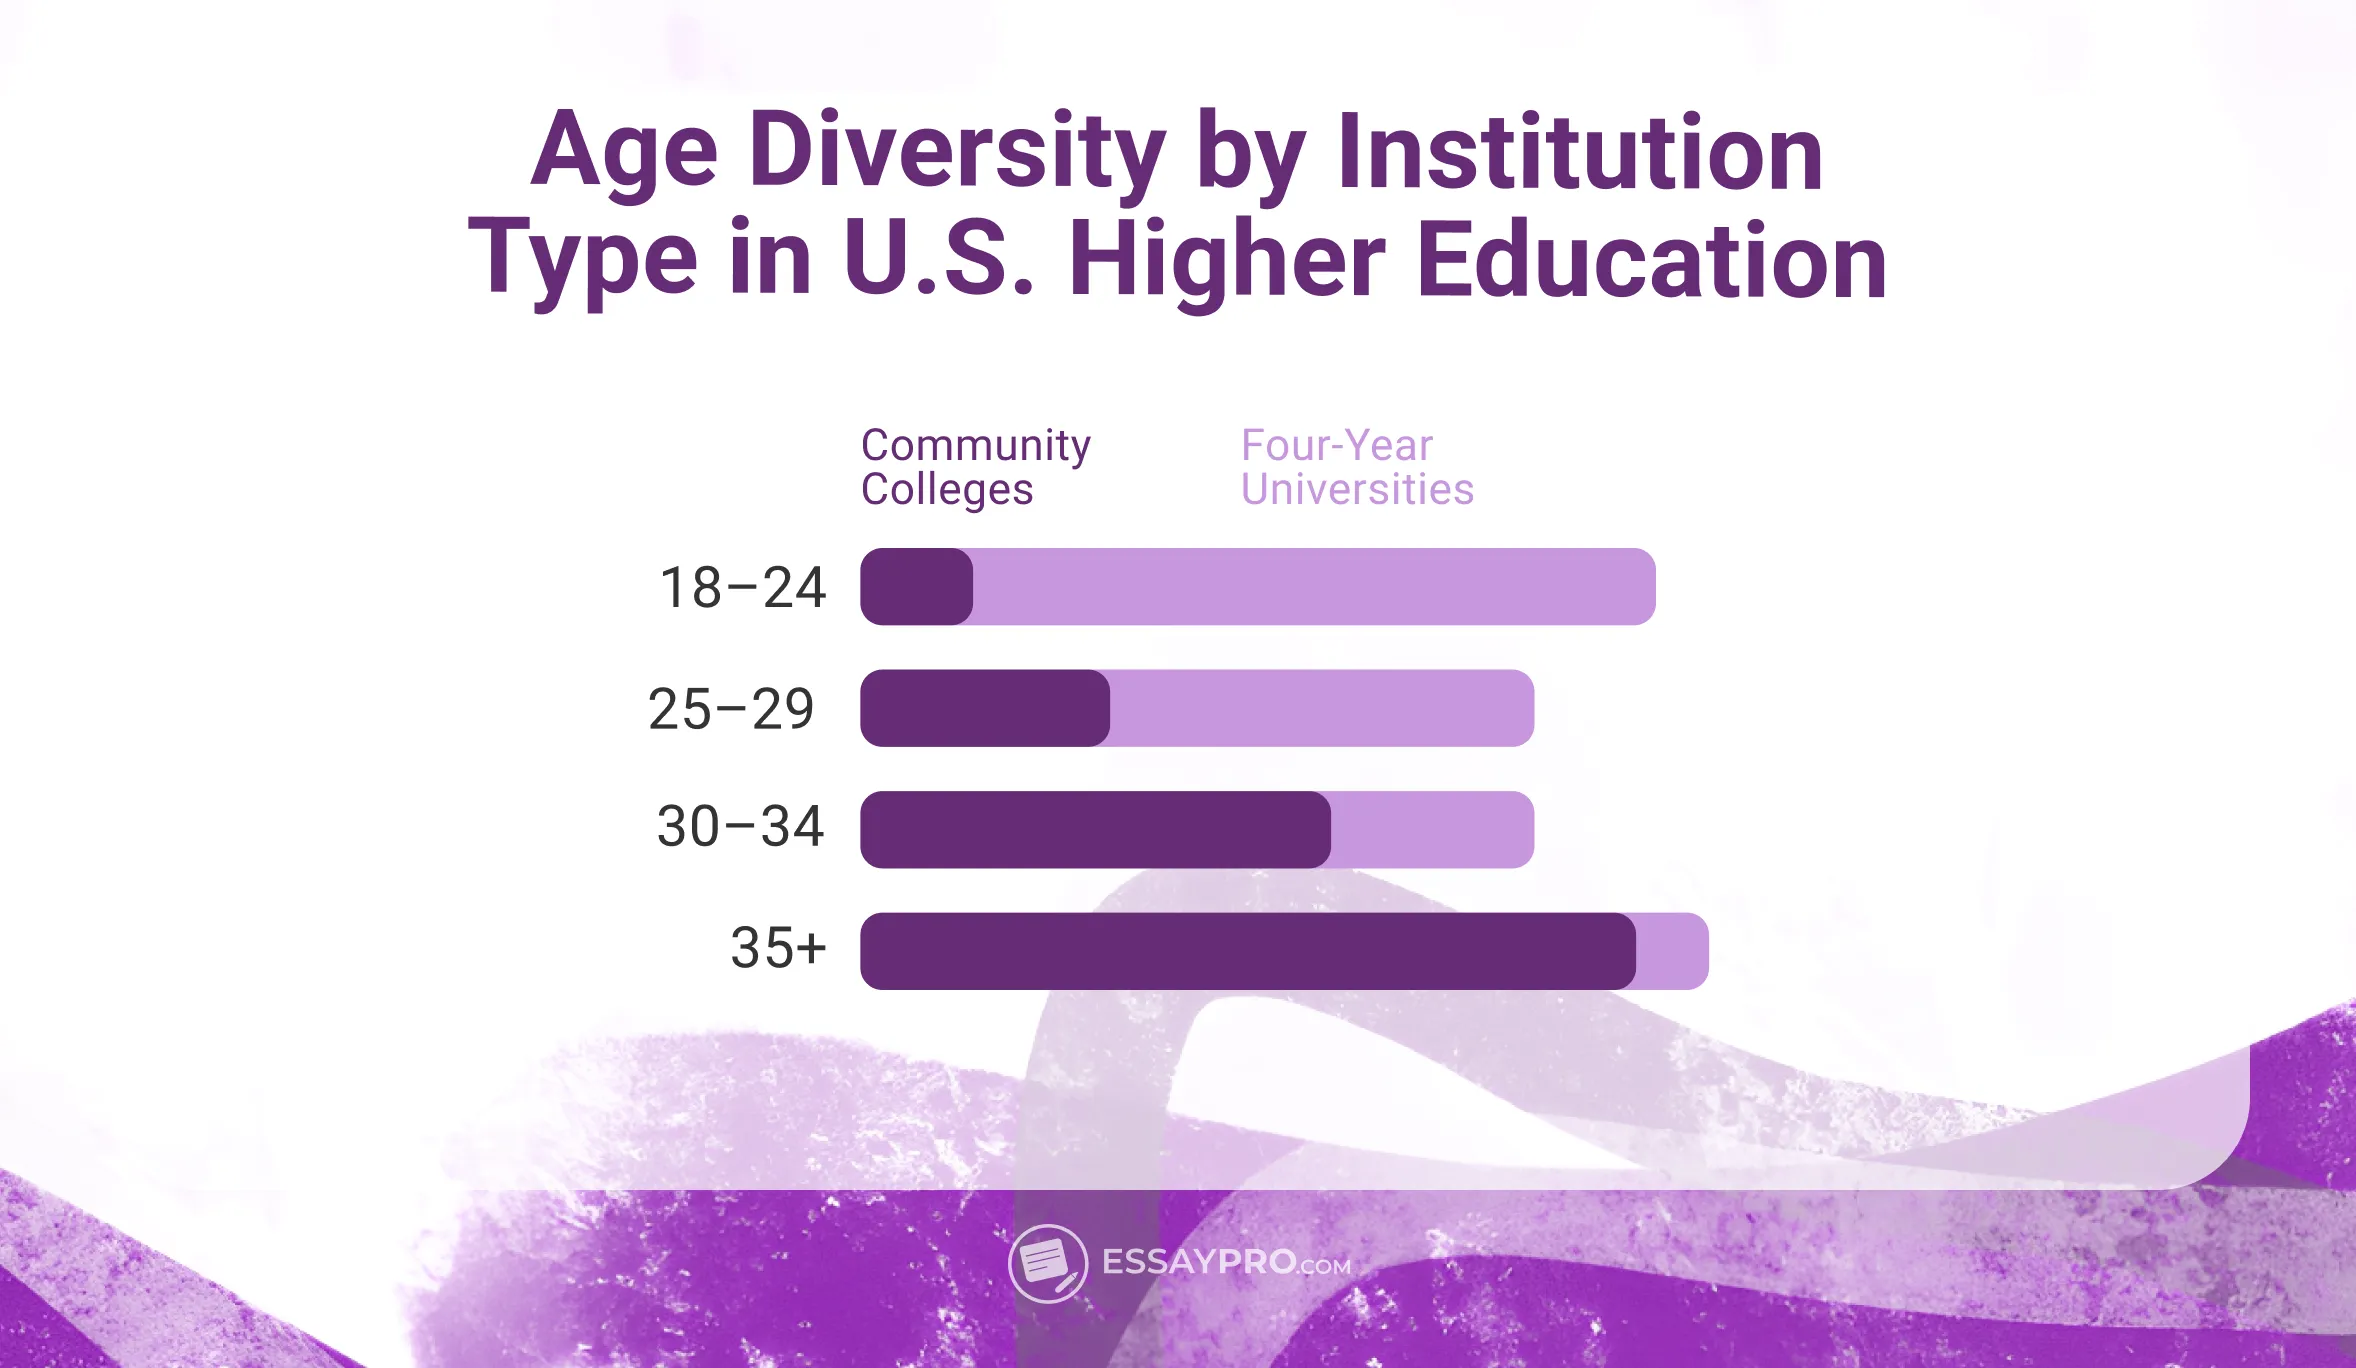
Age diversity depends on the school type. For example, community college campuses have older students, parents, and career changers, while four-year universities are composed mostly of young adults (18-24). Public 2-year schools show the biggest age range overall.
In a way, age diversity is proof that higher education is no longer limited to one life stage. It serves several at once, and each brings its own version of what college is supposed to achieve.
International Students Diversity
In the 2022-23 academic year, roughly 1.06 million international students were enrolled. Most of these students cluster in research universities, especially the ones with strong engineering, business, and technology programs.
Undocumented students face a distinctly different set of challenges, and their numbers are more difficult to determine with precision. The estimates show that around 427,000 students are undocumented, and 181,000 qualify for Deferred Action for Childhood Arrival (DACA) status. The experiences of these students depend almost entirely on the policies of the state in which they live. Some states offer in-state tuition, while others provide little to no institutional aid. Because of that, the daily experience of undocumented students is shaped more by the policies and financial strain than by the academic rigor.
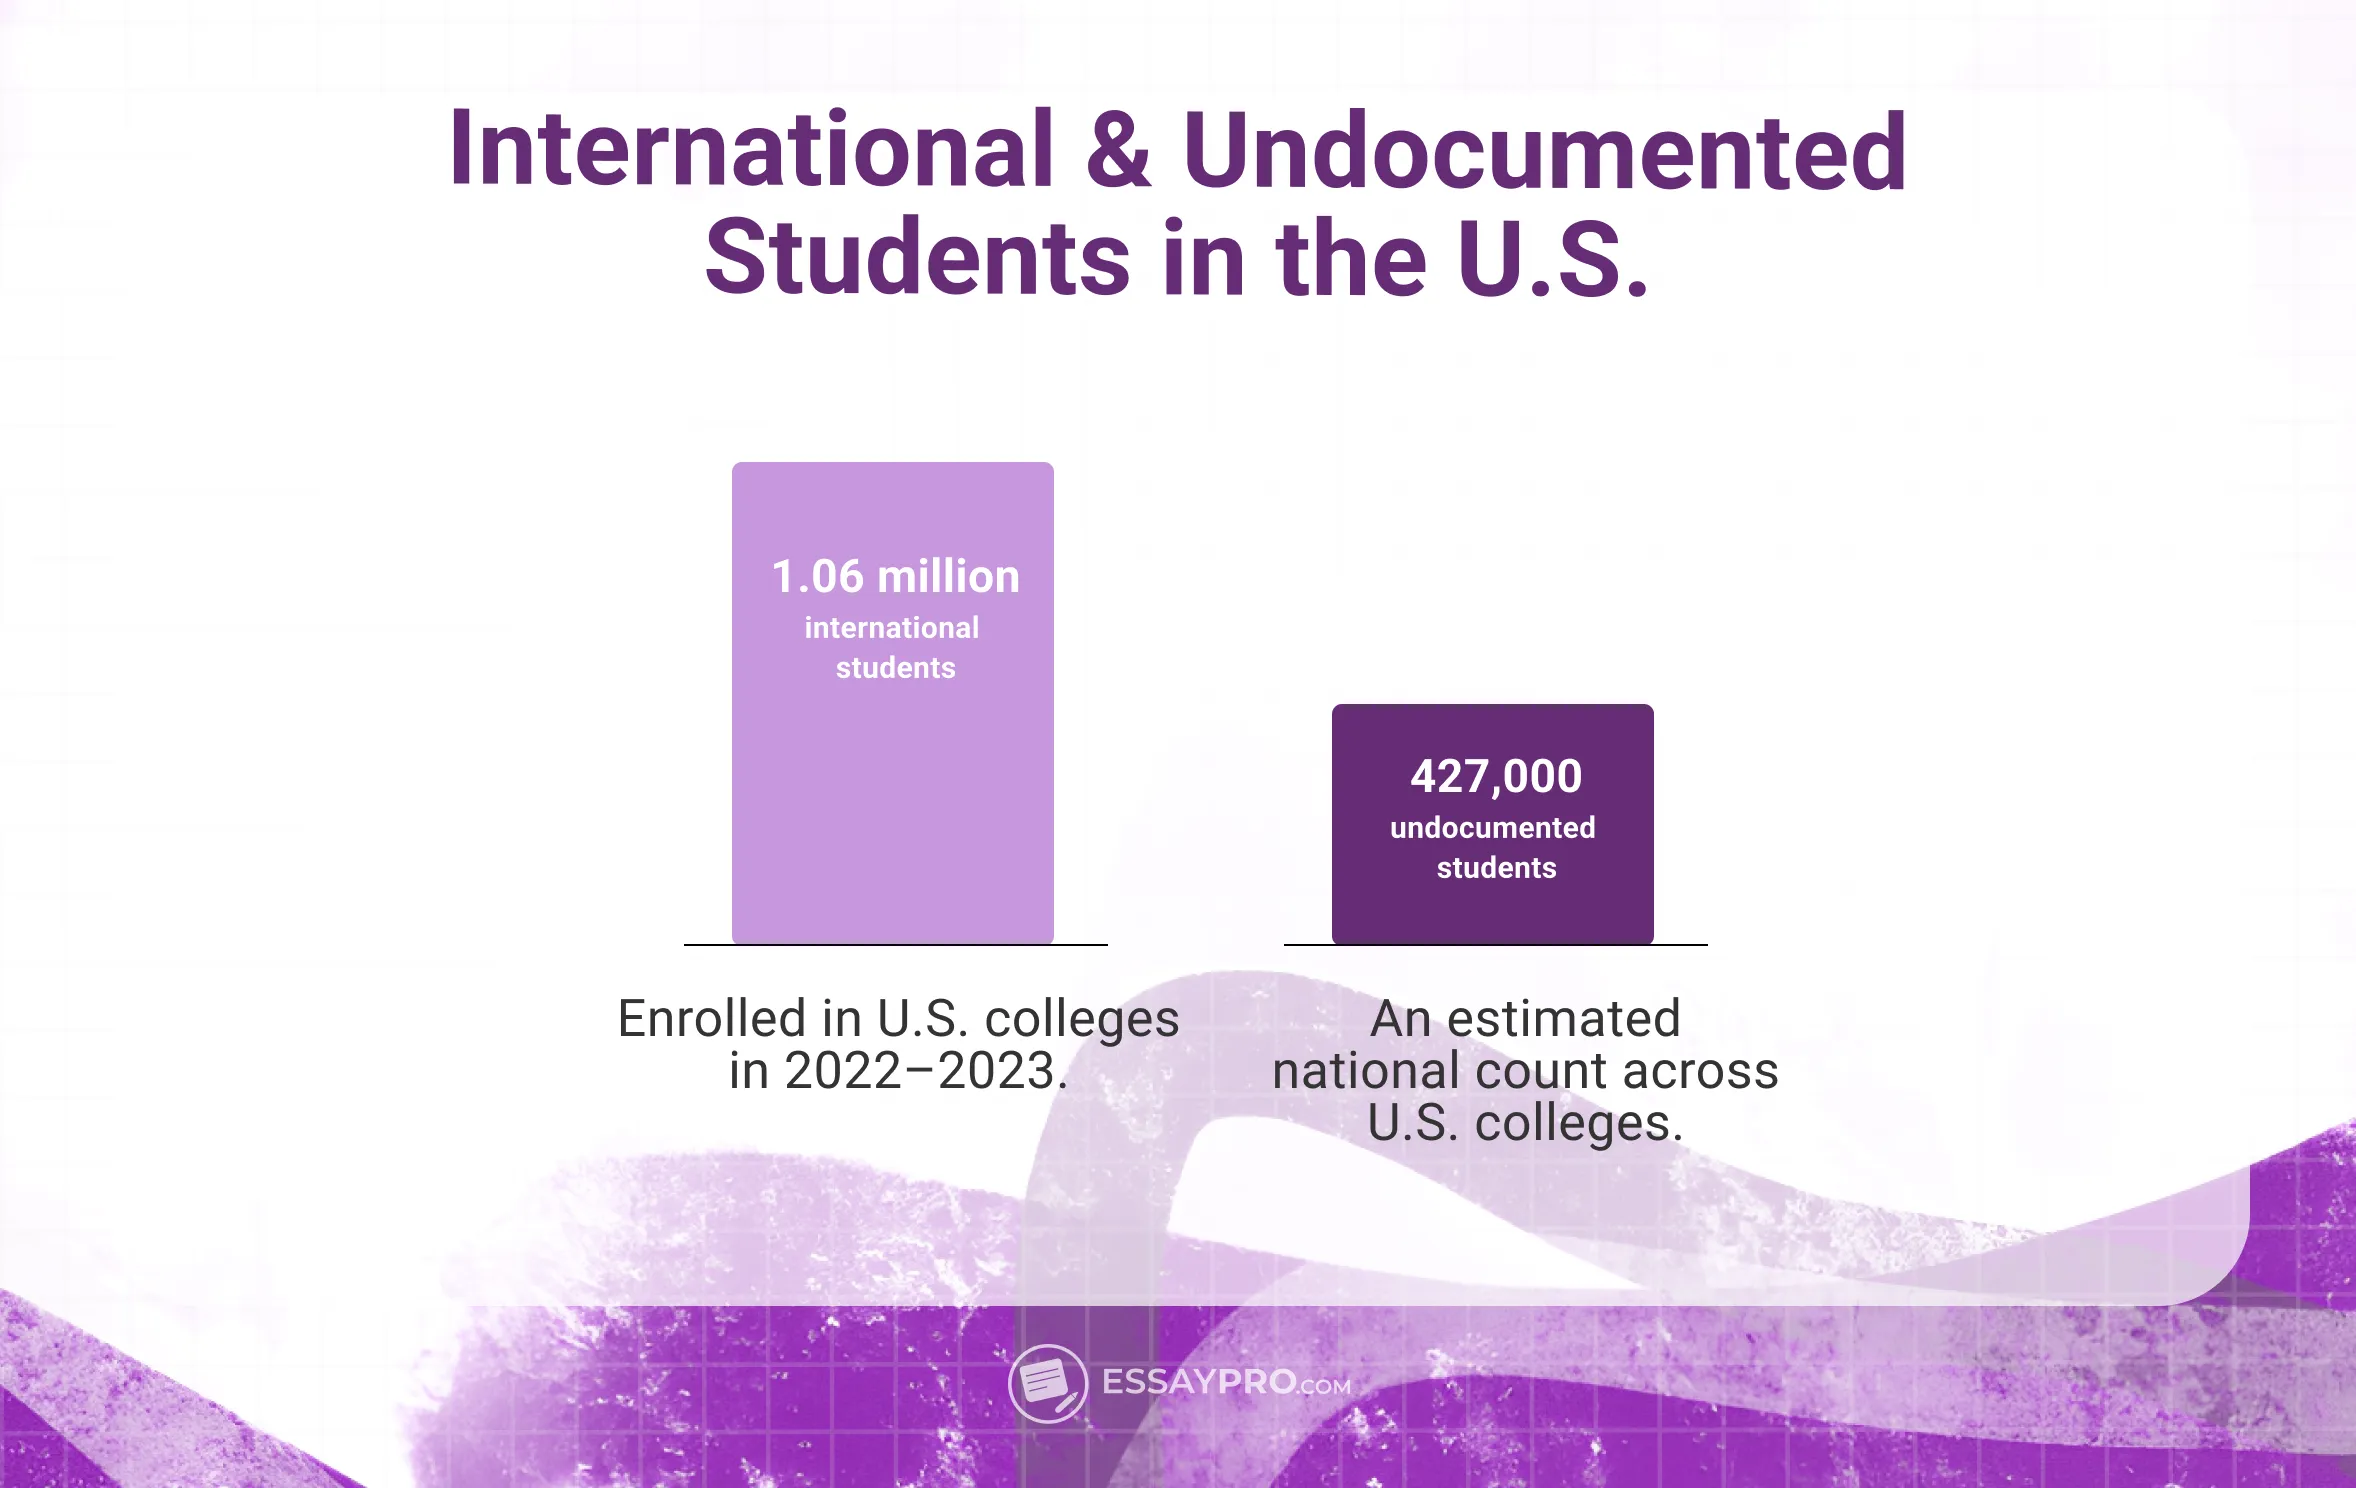
What becomes evident as we compare these two groups is that international students and undocumented students widen diversity in entirely different directions. International students bring languages, prior schooling systems, and expectations formed in entirely different educational cultures. Undocumented students bring another kind of diversity, tied to work schedules and financial uncertainty.
Higher Education Faculty Diversity
The contrast between student and faculty diversity issues in higher education is significant. In the fall of 2022, 72% of faculty were white. As for the gender difference, it’s almost even, with 35 percent of white women and 37 percent of white men.
Native American/Alaska Native and Pacific Islander faculty are well under one percent.
Rank adds another layer. White men consistently occupy the largest share, at about 39 percent. Asian men follow at 8 percent. As we move down the ladder, women appear at the instructor and lecturer levels more often than in full professorships.
The disparity between professor and non-professor roles reveals a structural issue. In the non-professor ranks, about a third of faculty are white men. In the professor ranks, that climbs to nearly forty percent. Asian men also increase their representation as the rank rises. Meanwhile, Hispanic women, Black women, and other underrepresented groups hold small fractions of the professoriate despite their larger presence in the lower tiers. The pipeline narrows early, and the data makes that clear without needing much interpretation.
Where Serious Students Go for Serious Results.
Reliable, confidential, human-crafted papers — EssayPro has your back 24/7.
What are the Benefits of Diversity in Colleges
More voices, better ideas, and richer conversations are the benefits of diversity in higher education, but there are more when we look closer at the importance of diversity in college:
- Diversity produces stronger cognitive endurance, not just more ideas. Homogeneous groups tend to reach agreement quickly. It feels smooth, but it leads to weaker reasoning. In mixed groups, students anticipate disagreement, and that extra cognitive engagement builds endurance and analytical sharpness over a semester, preparing students more rigorously.
- Diverse learning environments reduce overgeneralization errors. Students exposed to a narrow peer group often build theories based on small samples. When the room reflects a wider slice of society, they learn how easily ideas break once diverse perspectives enter. That habit carries into research design, policy thinking, and leadership decisions.
- Diversity improves institutional stability by broadening trust networks. When students see themselves represented in peers, staff, and faculty, they form stronger social bonds. These connections cushion academic pressure and support higher retention rates.
- Diverse cohorts generate more resilient long-term career outcomes. Research shows that students who learn in diverse campus settings build broader professional networks. Those networks continue to evolve years after graduation and expose individuals to industries and opportunities they may not otherwise encounter. Career mobility rises not because students 'network better,' but because they enter adulthood with a wider map of what is possible.
Academic Diversity Challenges
In 2025, we face a lack of diversity in higher education, some of which is evident in data, while others show up in the school hallways and classrooms.
- Access, retention, and completion: Enrollment has opened up, but staying enrolled still depends on factors that are unevenly distributed, including financial strain, confusing bureaucracy, and the unavailability of support systems.
- Campus climate: Representation doesn’t automatically produce comfort. Many students talk about feeling present, yet not fully included.
- Policy shifts and DEI pushback: There has been a noticeable shift in how institutions manage diversity offices and DEI initiatives. The result is a landscape that feels unsettled. Students and faculty sense the uncertainty, especially when an initiative launched one year becomes optional the next.
- Faculty and leadership representation: Students enter classrooms shaped by the most diverse generation in college history, yet they often encounter leadership and professorial ranks that reflect an earlier demographic reality. It creates a disconnect that’s unmistakable in mentoring relationships, research opportunities, and the general feeling of who holds authority on campus.
- Data without action: Most institutions collect diversity data, but fewer translate it into concrete steps. Some release lengthy reports yet avoid addressing the most uncomfortable findings. Others gather the numbers but never follow through on implementation. Progress slows when accountability relies on enthusiasm instead of systems.
Ways to Promote Diversity in Higher Education
Supporting diversity is a chain of decisions, each one essential to long-term change. Here are some of the most effective ways to promote diversity in higher education:
Improving the accessibility:
- Creating financial safety nets: Institutions often underestimate the fragility of the financial situation for many students and how these emergencies can lead to academic setbacks. Colleges can build rapid-response funds, short-term microgrants, and flexible payment plans.
- Recruiting a more diverse faculty: With a diverse faculty, students see new possibilities, mentorship becomes easier, and classrooms expand their range. The challenge is keeping the faculty who arrive. Promotion practices, workload equity, and recognition of invisible labor often determine whether they stay long enough to shape the institution’s culture.
- Using data for action: The difference between symbolic and serious action shows up in what happens after analyzing charts and percentages every year. Institutions can track equity gaps as they grow, identify bottlenecks in certain majors, or examine where financial strain is most pronounced. When data drives actual decisions, such as staffing, advising, and course scheduling, change accelerates.
These steps work alongside modern campus innovations, including new approaches highlighted in our article on examples of digital transformation in higher education.
Final Words
The numbers reveal a slow yet steady change in higher education diversity. The challenge now is making sure the structure around students evolves with the population it serves. When institutions build support systems that match their communities, expand the pathways that lead students into college, and create environments where more voices carry weight, the data begins to tell a different story, and a stronger one.
As colleges expand their efforts to support diverse learners, external academic resources play a complementary role. At EssayPro, we give students another avenue for strengthening their writing skills and keeping pace with demanding coursework.
When You Need More Than AI
Don’t risk AI detection. Get 100% human-written papers from EssayPro experts.
FAQs
What is Diversity in College?
What Are the Statistics for Diversity in Higher Education?
Why Is Diversity Important in Higher Education?
Is Higher Education Becoming More Diverse?
How Does Diversity Affect Student Achievement?

Sopho Miller
is an experienced content writer who specializes in digital marketing, business, and academic topics. With a Master’s degree in Digital Marketing, she combines her expertise with a practical approach to create clear, engaging, and educational content. She crafts detailed guides and resources that support students in their academic journey. Outside of work, Sopho stays current with the latest industry trends and regularly attends workshops to further sharpen her skills.
- University and College Designers Association. (n.d.). What does diversity mean in higher education? https://www.ucda.com/what-does-diversity-mean-in-higher-education/
- National Center for Education Statistics. (n.d.). Fast facts. https://nces.ed.gov/fastfacts/display.asp?id=61
- National Center for Education Statistics. (2023). Digest of education statistics: Table 303.10. https://nces.ed.gov/programs/digest/d23/tables/dt23_303.10.asp
- National Student Clearinghouse Research Center. (n.d.). Current term enrollment estimates. https://nscresearchcenter.org/current-term-enrollment-estimates/
- Equity in Higher Education. (2024, May). REHE 2024 full report. https://www.equityinhighered.org/wp-content/uploads/2024/05/REHE2024_Full_Report.pdf#:~:text=,3
- EducationData.org. (n.d.). College enrollment statistics. https://educationdata.org/college-enrollment-statistics