

A statistics project can seem simple until you try to do one yourself. You need an interesting question, data you can feasibly obtain, and results that actually matter. Students often get stuck at the very start, trying to figure out what to study. Once you pick weak statistics project ideas, every step that follows will be more difficult.
Here we solve that problem. Below, you'll find the best statistics project ideas for students, covering real-world topics such as health & sports, education, social media, the environment, business, and psychology. Choose a topic that fits your project, and you’re ready to get started.
What Is a Statistics Project?
A statistics project is an inquiry that involves asking a question you care about. This goes beyond crunching numbers from a textbook. It’s the entire process that statisticians use: coming up with a question you want to answer, finding data to answer your question, crunching the numbers, and drawing conclusions you can support. Typically, a project will include five parts: a question, a data collection plan, the data, your analysis, and your conclusion.
Here are some topics for statistics project to bring this to life:
- Which students get better grades: those who sleep more or those who don't? Ask your classmates how many hours they sleep and what grade they got on a test.
- Does music speed up how fast people walk? Time people as they walk by, playing music at different speeds.
- Do you use social media more on the weekends or weekdays? Take data from your own day-to-day life by monitoring your screen time.
At its core, a statistics project means converting a question into a measurable data point.
Struggling to Turn Numbers Into a Project?
Work with experts to refine your topic, analyze data, and structure your findings.

How to Choose the Best Statistics Project Idea
Finding the perfect idea shouldn’t slow you down. Run your topic through these five quick tests to see if it’s worth your time.
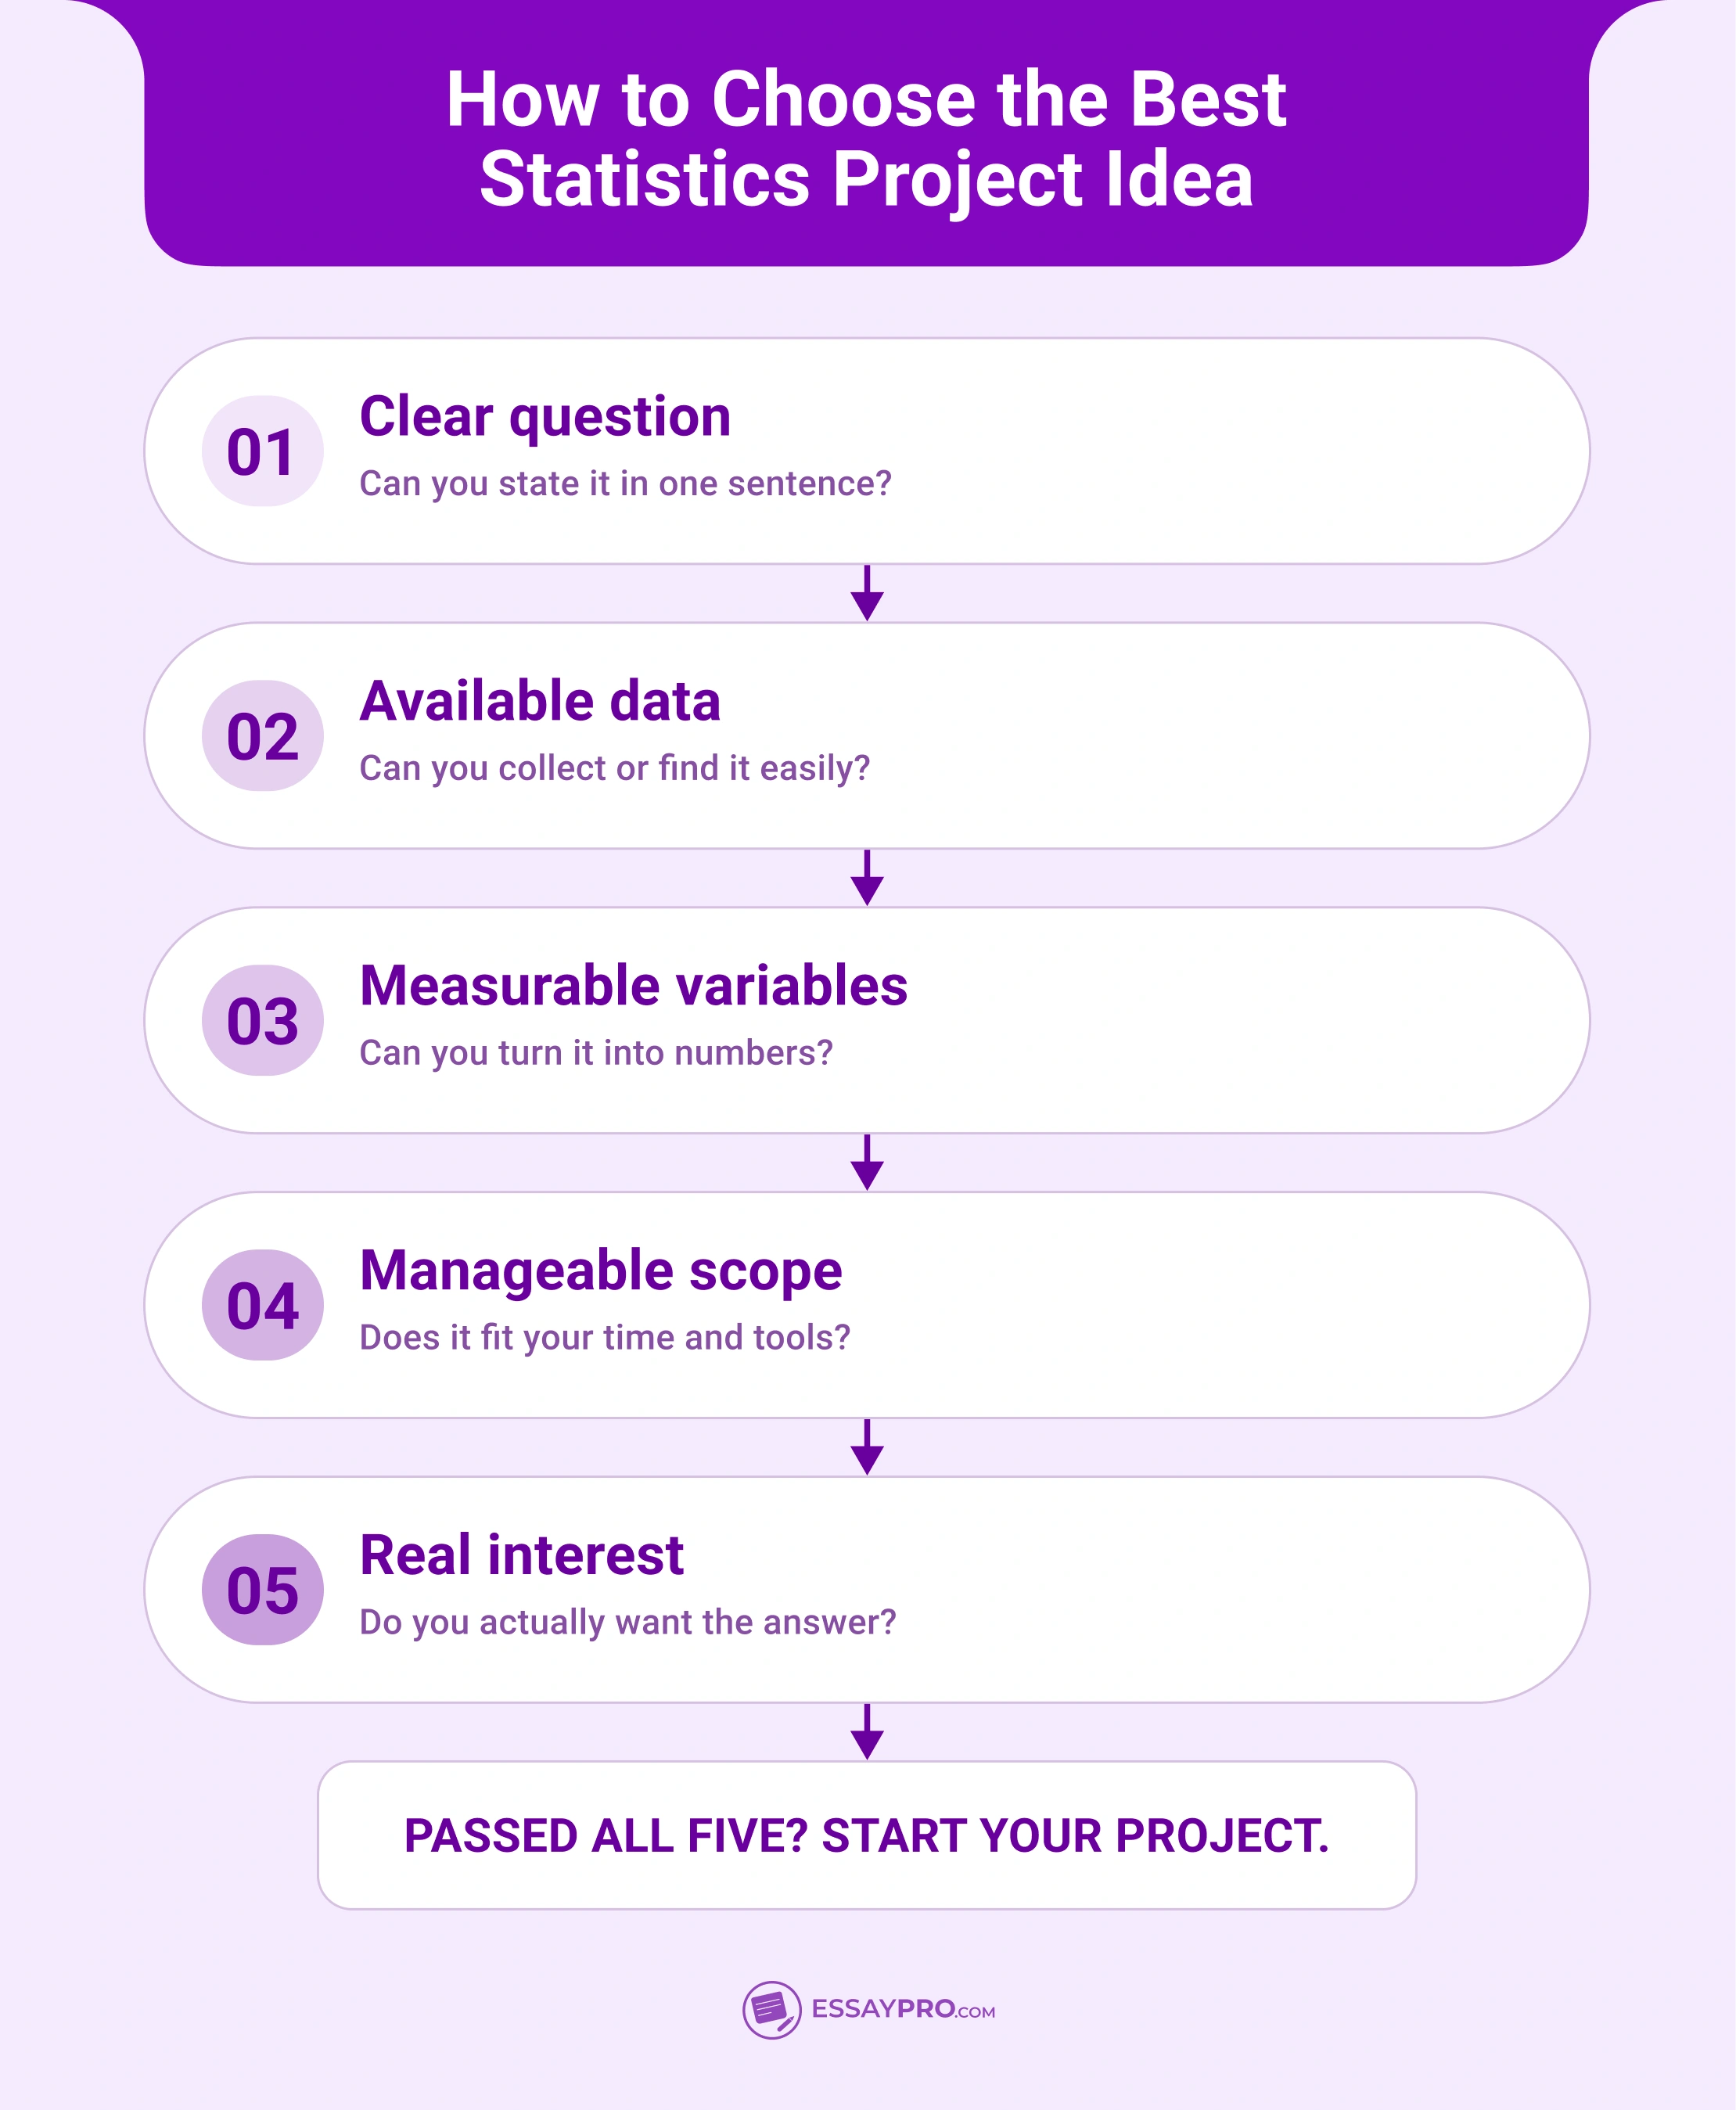
- Specific question: Can you write it as a one-sentence question?
- Accessible data: Can you easily find or collect the data?
- Quantifiable variables: Can you convert variables into numbers?
- Scoped appropriately: Is it possible with your time and resources?
- Interested in the answer: Do you want to know the answer?
If you can answer yes to all of the above, you’re good to go!
Remember: Data is often the make-or-break of a data visualization. Don’t settle on a topic until you know where to get the data. Try one of these three sources to find free datasets.
- Kaggle hosts thousands of public datasets uploaded by users. Perfect for data science or predictive modeling.
- The U.S. Census Bureau has a ton of demographic and economic data you can use to explore project topics in statistics, such as urbanization, income inequality, or migration.
- Google Dataset Search is a search engine for academic and scientific datasets.
Pro Tip: Verify that you can find data for your project before you fall in love with a question.
A List of Statistics Project Ideas
Time for the fun part: choosing your idea. Here are over 150 statistics project topics, divided into sixteen categories and ranging from simple to advanced, waiting for you to explore. Every idea is focused around a question that can be measured, so browse through the category that best suits your assignment and choose the question that interests you.
Easy Statistics Project Ideas
- Do students who eat breakfast score higher on quizzes?
- What is the average daily screen time in your class?
- Does shoe size relate to height among your classmates?
- How many hours of sleep do students get on school nights?
- What is the most common way students get to school?
- Do people prefer texting or calling, by age group?
- How does daily water intake vary across your class?
- What is the average number of apps on students' phones?
- Do left-handed people prefer different sports than right-handed people?
- How many books do students read per month?
If you're balancing multiple assignments, our fast essay writing service can help manage the workload more effectively.
Fun Statistics Project Ideas
- Which pizza topping is most popular in your school?
- Do people really taste a difference between soda brands?
- What is the most common birthday month in your grade?
- Does the tempo of music affect how fast people walk?
- Which movie genre do students rewatch the most?
- Are coin flips truly 50/50 over hundreds of tries?
- Does the color of a candy affect which one people pick?
- How accurate are people at guessing a minute without a clock?
- Which emoji gets used most in group chats?
- Do people remember dreams more on weekends?
Probability and Statistics Project Ideas
- What are the real odds of winning common dice games?
- How does the gambler's fallacy show up in coin flips?
- Can you predict card draws better than random chance?
- What is the probability of shared birthdays in your class?
- How often do "random" playlists actually repeat artists?
- What are the odds of specific outcomes in a board game?
- Does a weighted die change results in a measurable way?
- How does sample size affect probability estimates?
- What is the chance of rain matching the forecast in your city?
- Can the Monty Hall problem be confirmed through trials?
AP Statistics Project Ideas
- Is there a correlation between study time and test scores?
- Does the class section affect average grades, as tested with ANOVA?
- Can you predict college GPA from high school GPA?
- Is there a gender difference in reaction times?
- Does caffeine intake correlate with hours of sleep?
- Are exam scores normally distributed across a grade?
- Does seating position relate to participation rates?
- Is there a link between part-time work hours and grades?
- Can you model the spread of a rumor through a school?
- Does exercise frequency predict resting heart rate?
Community Studies Statistics Project Ideas
- How does participation in recycling vary by neighborhood?
- What are the most common reasons people visit the local library?
- How does traffic volume change throughout the day downtown?
- What percentage of local businesses offer outdoor seating?
- How far do residents travel for their weekly groceries?
- What is the average wait time at local bus stops?
- How do park usage patterns differ on weekdays and weekends?
- What share of households participate in community events?
- How accessible are public spaces for people with disabilities?
- What are the most requested services at the community center?
Psychology Statistics Project Ideas
- Does color affect mood ratings in a controlled test?
- Is there a link between social media use and self-reported stress?
- Does background noise affect memory recall?
- Do people conform to group answers in a simple test?
- Does birth order relate to self-reported risk-taking?
- How does sleep affect reaction time and focus?
- Does music improve or hurt concentration while studying?
- Are first impressions accurate predictors of later opinions?
- Does the framing of a question change people's answers?
- How does reward affect persistence on a difficult task?
Education Statistics Project Ideas
- Does homework time correlate with test performance?
- Do later school start times improve attendance?
- How does class size relate to student participation?
- Does note-taking by hand beat typing for recall?
- What teaching methods do students rate most effective?
- Does access to technology affect grades?
- How does attendance relate to final course scores?
- Do students perform better in the morning or in the afternoon?
- Does group study improve outcomes over solo study?
- How does test anxiety vary across grade levels?
Statistical Analysis Project Ideas
- What factors best predict housing prices in your area?
- Can you find trends in local weather data over a decade?
- What variables correlate most with car fuel efficiency?
- How have streaming habits shifted using public datasets?
- What predicts movie box office success?
- Can you identify patterns in public crime statistics?
- What factors relate to a country's life expectancy?
- How do unemployment and inflation move together over time?
- What variables predict student dropout rates?
- Can you cluster cities by quality-of-life indicators?
Statistics Survey Project Ideas
- What are students' top sources of stress?
- How do spending habits differ by age group?
- What factors influence students' college choices?
- How satisfied are people with public transportation?
- What are the most common diet preferences in your school?
- How do people rate their work-life balance?
- What do students value most in a part-time job?
- How do news consumption habits vary by generation?
- What are people's biggest barriers to exercising?
- How do shopping preferences differ online versus in-store?
Many statistics projects involve spreadsheets and data analysis. If you find yourself wondering,’Can I pay someone to do my excel homework?’, our support is just one click away.
Economics Statistics Project Ideas
- How does minimum wage relate to the local cost of living?
- What factors predict consumer spending during holidays?
- How do gas prices affect public transit ridership?
- Is there a link between education level and income?
- How has inflation affected grocery prices over the past five years?
- What predicts small business survival rates?
- How does unemployment vary across regions?
- Does income inequality correlate with health outcomes?
- How do interest rates affect housing demand?
- What factors drive student loan debt levels?
Technology Statistics Project Ideas
- How does screen time relate to reported sleep quality?
- What percentage of students use AI tools for homework?
- How fast do app preferences change among teens?
- Does device type affect how long people stay online?
- What factors predict how quickly people adopt new tech?
- How does notification frequency affect focus?
- What share of daily phone use is social media?
- How does internet speed vary across neighborhoods?
- Do people read or skim digital articles, measured by time?
- How accurate are fitness trackers compared to manual counts?
Healthcare Statistics Project Ideas
- Does sleep duration correlate with reported stress levels?
- How does physical activity relate to resting heart rate?
- What factors predict vaccination rates by region?
- How does diet relate to energy levels in a daily log?
- What is the link between screen time and eye strain?
- How do hydration habits vary across age groups?
- Does step count correlate with reported mood?
- How accessible is healthcare across different areas?
- What factors relate to flu rates during the winter months?
- How does sugar intake vary across meal types?
Environmental Statistics Project Ideas
- How does local air quality change throughout the week?
- What factors correlate with household water usage?
- How much waste does your school produce daily?
- How do recycling rates vary by neighborhood?
- What is the relationship between temperature and energy use?
- How does paper use change after a digital initiative?
- What share of local trips could be made by bike?
- How has rainfall in your region changed over the decades?
- What factors predict household electricity consumption?
- How does plastic use vary across grocery stores?
Demographic Statistics Project Ideas
- How has your town's population changed over time?
- What is the age distribution of your neighborhood?
- How does household size vary across regions?
- What migration patterns appear in local census data?
- How does educational attainment vary by area?
- What is the relationship between age and commute distance?
- How has family structure changed over the decades?
- What predicts homeownership rates across regions?
- How does population density relate to public services?
- What demographic factors correlate with voter turnout?
Some of these topics can also be expanded into larger capstone project ideas for advanced coursework.
Entertainment Statistics Project Ideas
- What factors predict a song's time on the charts?
- How do movie ratings relate to box office earnings?
- What genres dominate streaming watchlists?
- How long do popular video games hold players' attention?
- What predicts a viral video's view count?
- How do release dates affect a film's success?
- What share of a playlist do people actually finish?
- How do sequel ratings compare to originals?
- What factors relate to concert ticket prices?
- How does binge-watching vary across age groups?
Quantitative Statistics Project Ideas
- What variables best predict exam scores in a dataset?
- Can you build a regression model for housing prices?
- How do two teaching methods compare using a t-test?
- What factors correlate most with athletic performance?
- Can you model population growth over time?
- What predicts customer satisfaction scores?
- How do multiple variables affect fuel efficiency?
- Can you forecast sales using historical data?
- What factors explain variation in test reliability?
- How does sample size affect confidence intervals?
For data-heavy assignments, use our custom research paper writing services to assist with research and organization.
Statistics Project Ideas for Different Levels
The ideal project selection is tied to where you stand in your educational journey. Ideally, a high school project will be well defined and use data you can easily collect yourself. A college project can be larger in scale and use more advanced techniques. You will find ideas here tailored to your level.
Statistics Project Ideas High School
- Do students who sleep more earn higher grades?
- What is the most popular after-school activity in your grade?
- Does breakfast affect focus during morning classes?
- How much screen time does the average student get daily?
- Is there a link between study time and quiz scores?
- What percentage of students walk, bus, or drive to school?
- Does music help or hurt concentration while studying?
- How does daily water intake vary among classmates?
- Are reaction times different between athletes and non-athletes?
- What are the biggest sources of stress for students?
Statistics Project Ideas for College Students
- What factors best predict student GPA using survey data?
- Can you model local housing prices with regression?
- Is there a correlation between part-time work hours and academic performance?
- How do mental health indicators vary across majors?
- What variables predict customer satisfaction for a local business?
- How has your city's population shifted using census data?
- Does caffeine intake correlate with sleep quality and stress?
- What factors relate to voter turnout across regions?
- Can you forecast a trend using several years of public data?
- How do two study methods compare using a controlled experiment?
Students interested in science and data can explore related STEM research topics for additional project inspiration.
Have Data but No Project Idea?
Get expert help choosing a statistics topic that is practical, interesting, and researchable.
Statistics Project Ideas with Examples
Sometimes it's useful to see a full example project laid out from start to finish to understand how the pieces fit together. The following examples of statistics projects offer a clear picture of how a central idea, the data it relies on, and the methods applied are connected.
1) Problem: Does more sleep lead to better grades?
- Project: Look at the relationship between the number of hours students report sleeping and their most recent grades.
- Data: Student survey data about hours of sleep and most recent grades.
- Analysis: Correlation analysis, scatterplots, linear regression.
- Result: Identify if a linear relationship between sleep and grade exists, and how strong that relationship is.
2) Problem: Will a later school start time improve attendance?
- Project: Analyze the difference in attendance rates before and after a school's start time change, or between schools with different start times.
- Data: Public data on school attendance records and start times.
- Analysis: Descriptive statistics, two-sample t-test, line of best fit.
- Result: Visualize if there's a significant change in attendance following a change in start time.
3) Problem: What features predict housing prices in my city?
- Project: Build a model that uses features like size, location, number of bedrooms, etc. to predict home prices.
- Data: Public housing listings or another open dataset with information on housing sales.
- Analysis: Multiple regression, correlation analysis and data visualization.
- Result: An equation that estimates housing prices based on input features.
Final Word
Ideally, your statistics project will be based on a question you care about and data you can access. Settle on a clear research question, match it with an appropriate analytical process, and let the numbers tell the narrative. You're all set to go with the statistics project ideas here; just pick a subject and locate the data for your analysis.
FAQ
What Is the Best Topic for a Statistics Project?
How To Do a Statistics Project?
How Do You Gather Data for a Statistics Project?

Daniel Parker
is a seasoned educational writer focusing on scholarship guidance, research papers, and various forms of academic essays including reflective and narrative essays. His expertise also extends to detailed case studies. A scholar with a background in English Literature and Education, Daniel’s work on EssayPro blog aims to support students in achieving academic excellence and securing scholarships. His hobbies include reading classic literature and participating in academic forums.
- Data-Based Problemsolving. (n.d.). https://www.amstat.org/docs/default-source/amstat-documents/edu-statproject.pdf
- American Statistical Association. (n.d.). Statistics Project Guidelines. American Statistical Association. https://www.amstat.org/docs/default-source/amstat-documents/edu-statproject.pdf
- SPENCE, D. J., BAILEY, B., & SHARP, J. L. (2017). THE IMPACT OF STUDENT-DIRECTED PROJECTS IN INTRODUCTORY STATISTICS. STATISTICS EDUCATION RESEARCH JOURNAL, 16(1), 240–261. https://iase-pub.org/ojs/SERJ/article/view/230