
The United States hosted 1,177,766 international students from more than 200 places of origin during the 2024/25 academic year — the highest total on record, and a 5% increase over the previous year. India, China, and South Korea remained the top three places of origin.
The same Open Doors release carried a second dataset: the Fall 2025 Snapshot, a preliminary survey of 825 institutions covering the current academic year. It showed international enrollment down 1% overall and new enrollments down 17%, the steepest non-pandemic drop in more than a decade. Two numbers, one report, opposite directions.
Everything below untangles that. Full-year data first, then the current-year signals, then the policy changes that explain most of the gap.
Key Statistics
How many international students are in the U.S. right now?
Open Doors 2025 is the full-year benchmark: 1,177,766 students in 2024/25, roughly 6% of total U.S. higher education enrollment. This is the figure institutions, journalists, and policy analysts default to.
The Fall 2025 Snapshot is a partial-year survey of 825 institutions, published alongside Open Doors but describing a later period. It reports:
- Total international enrollment: −1%
- New enrollments: −17%
- Graduate: −12%
- Undergraduate: +2%
- OPT: +14%
More than half of surveyed institutions — 57% — enrolled fewer international students than the year before. 29% reported an increase; 14% were flat. And 96% cited visa application problems as an obstacle to enrollment.
Note that the −1% headline sits next to a majority of institutions reporting losses. That is not a contradiction. Averages flatten unevenness: a handful of large research universities holding steady can mask sharp declines at smaller schools.
Enrollment by year, 2018/19 to 2025/26
* Fall 2025 Snapshot, preliminary, 825 institutions. Full-year figures arrive with Open Doors 2026 in November.
The pandemic collapse
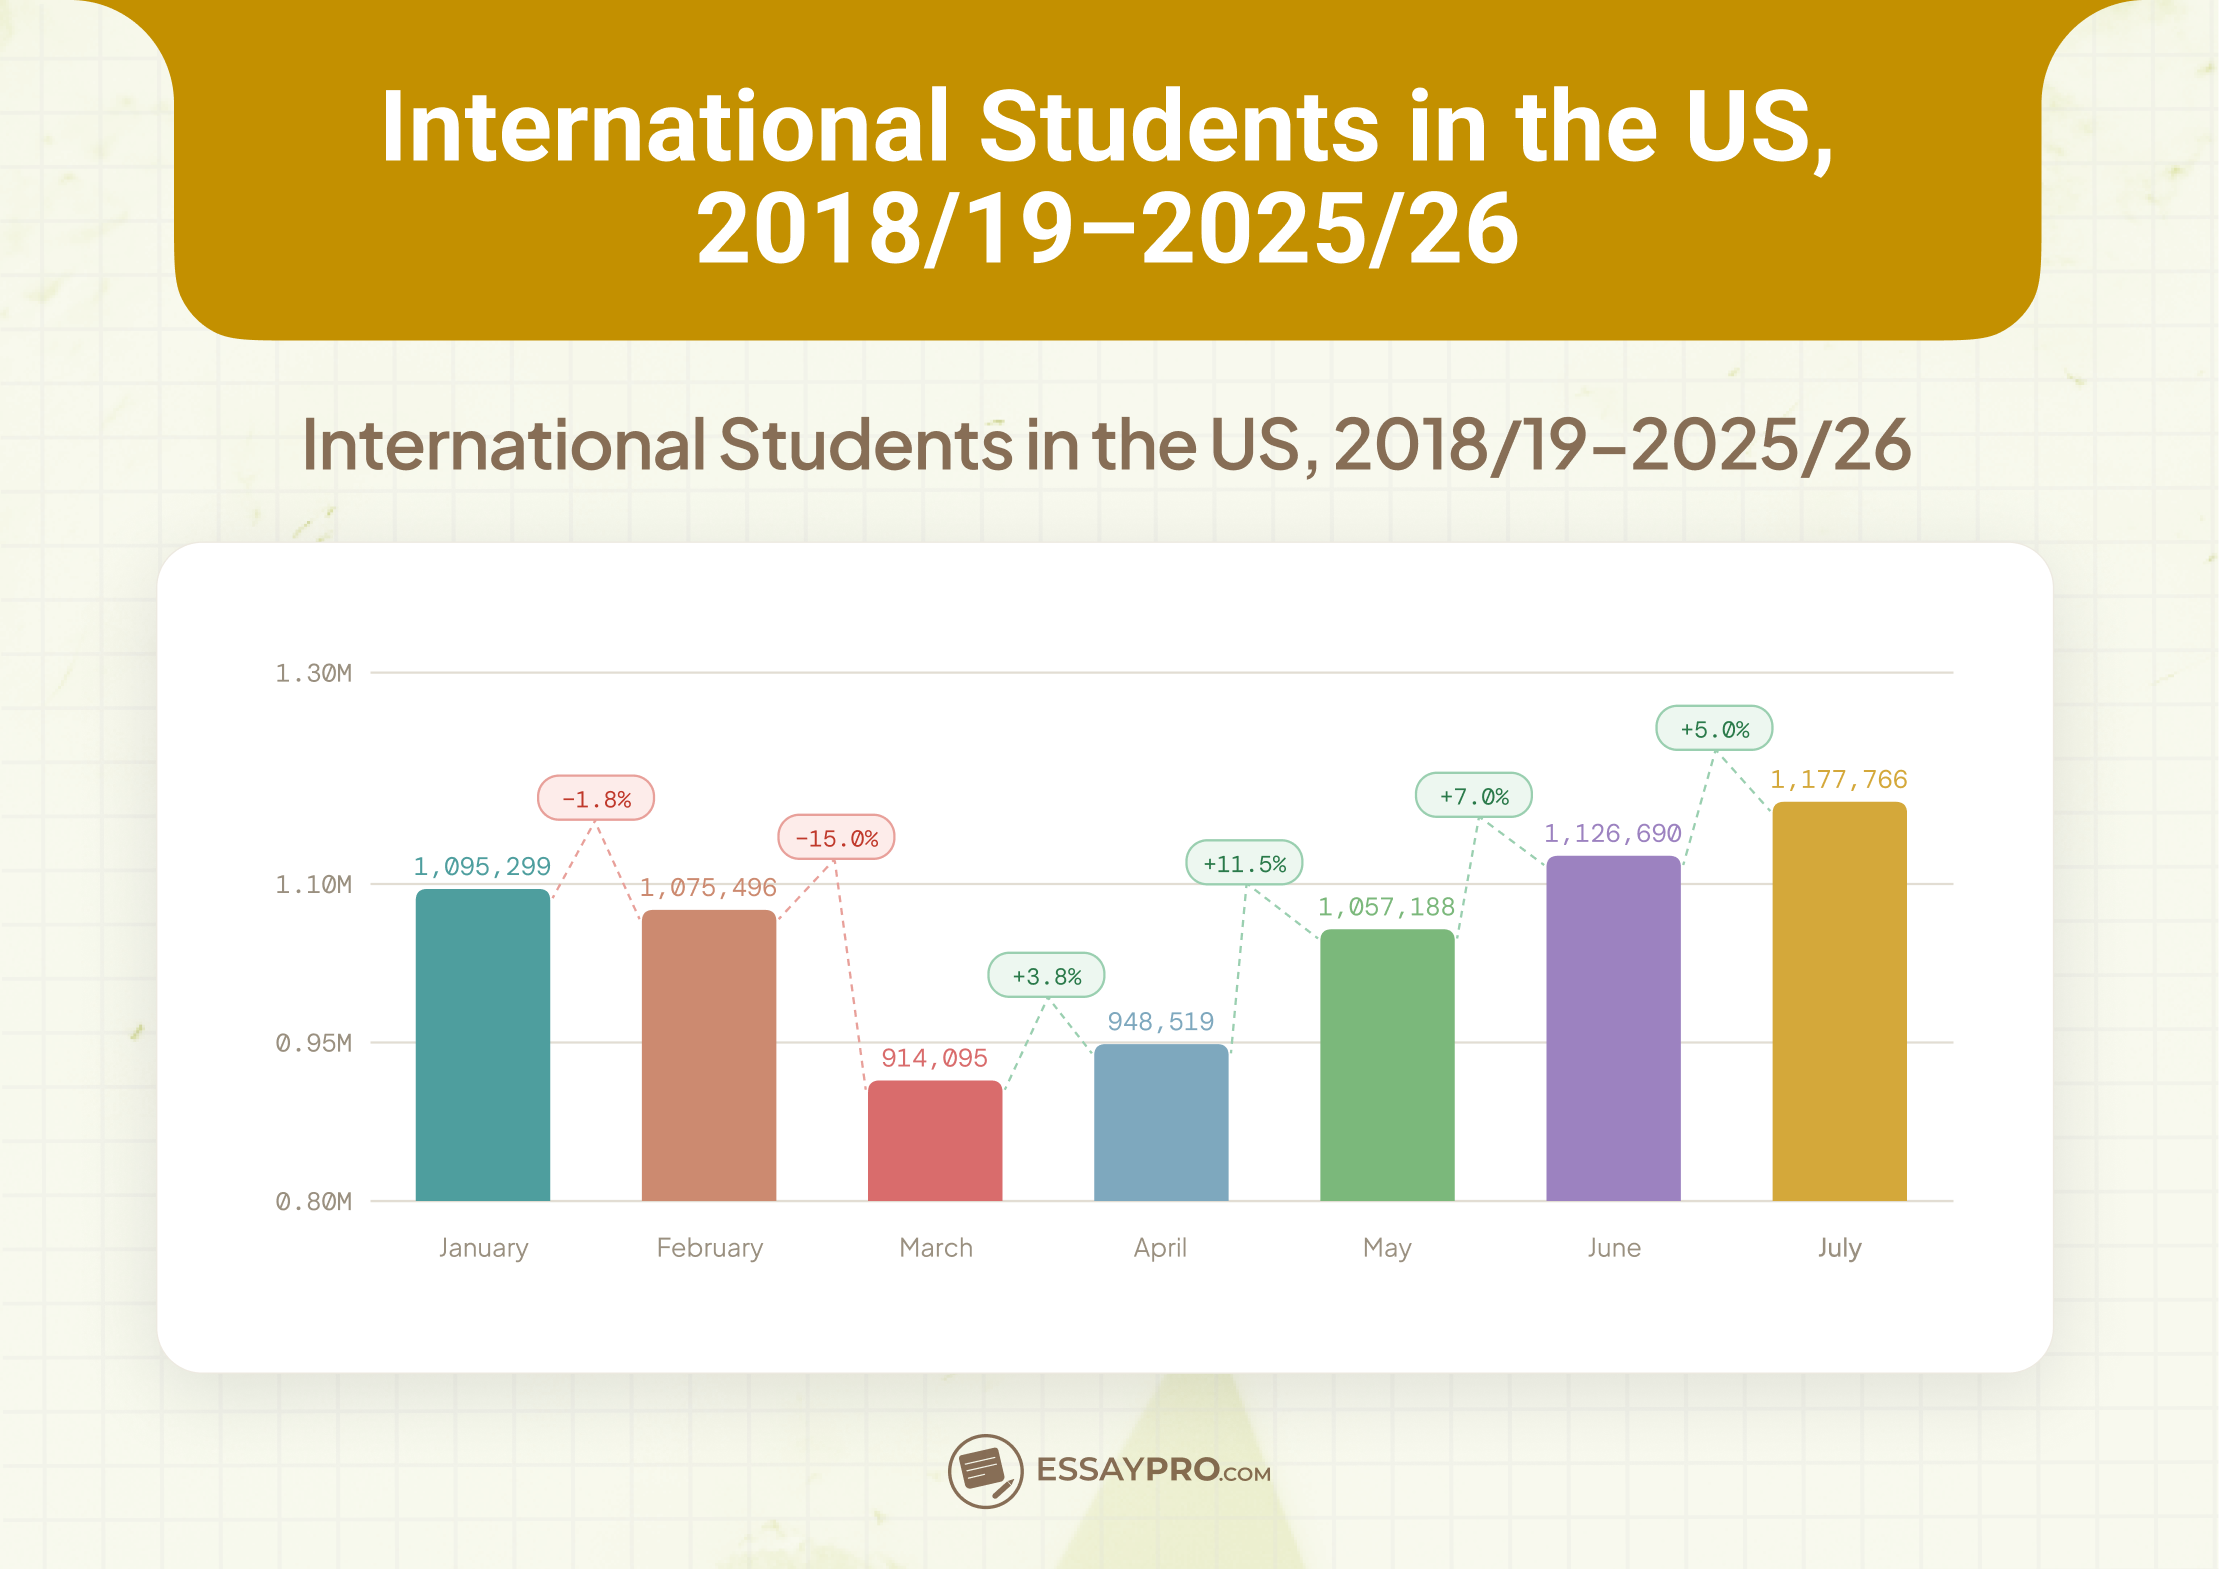
2020/21 produced the steepest single-year decline on record: total enrollment fell 15% to 914,095, while new enrollment nearly halved, dropping from 267,712 to 145,528.
Recovery was fast but uneven. New enrollment rebounded 80% in 2021/22; total enrollment did not return to pre-pandemic levels until 2022/23, when it grew 11.5% — the fastest single-year growth rate in over four decades.
The three record years, and the deceleration inside them
Growth ran +11.5%, then +7%, then +5%. Each record year was a smaller record than the last.
The 2024/25 breakdown shows why. Total enrollment rose, but new enrollment fell 7%, and graduate enrollment declined 3% after three consecutive years of growth. Growth came from two places: undergraduates, up 4% — the first meaningful increase at that level since the pandemic — and OPT, up 21% to 294,253.
That last point matters for interpreting the record. A substantial and growing share of the "international student" total consists of recent graduates working under OPT rather than students sitting in classrooms.
Where students come from
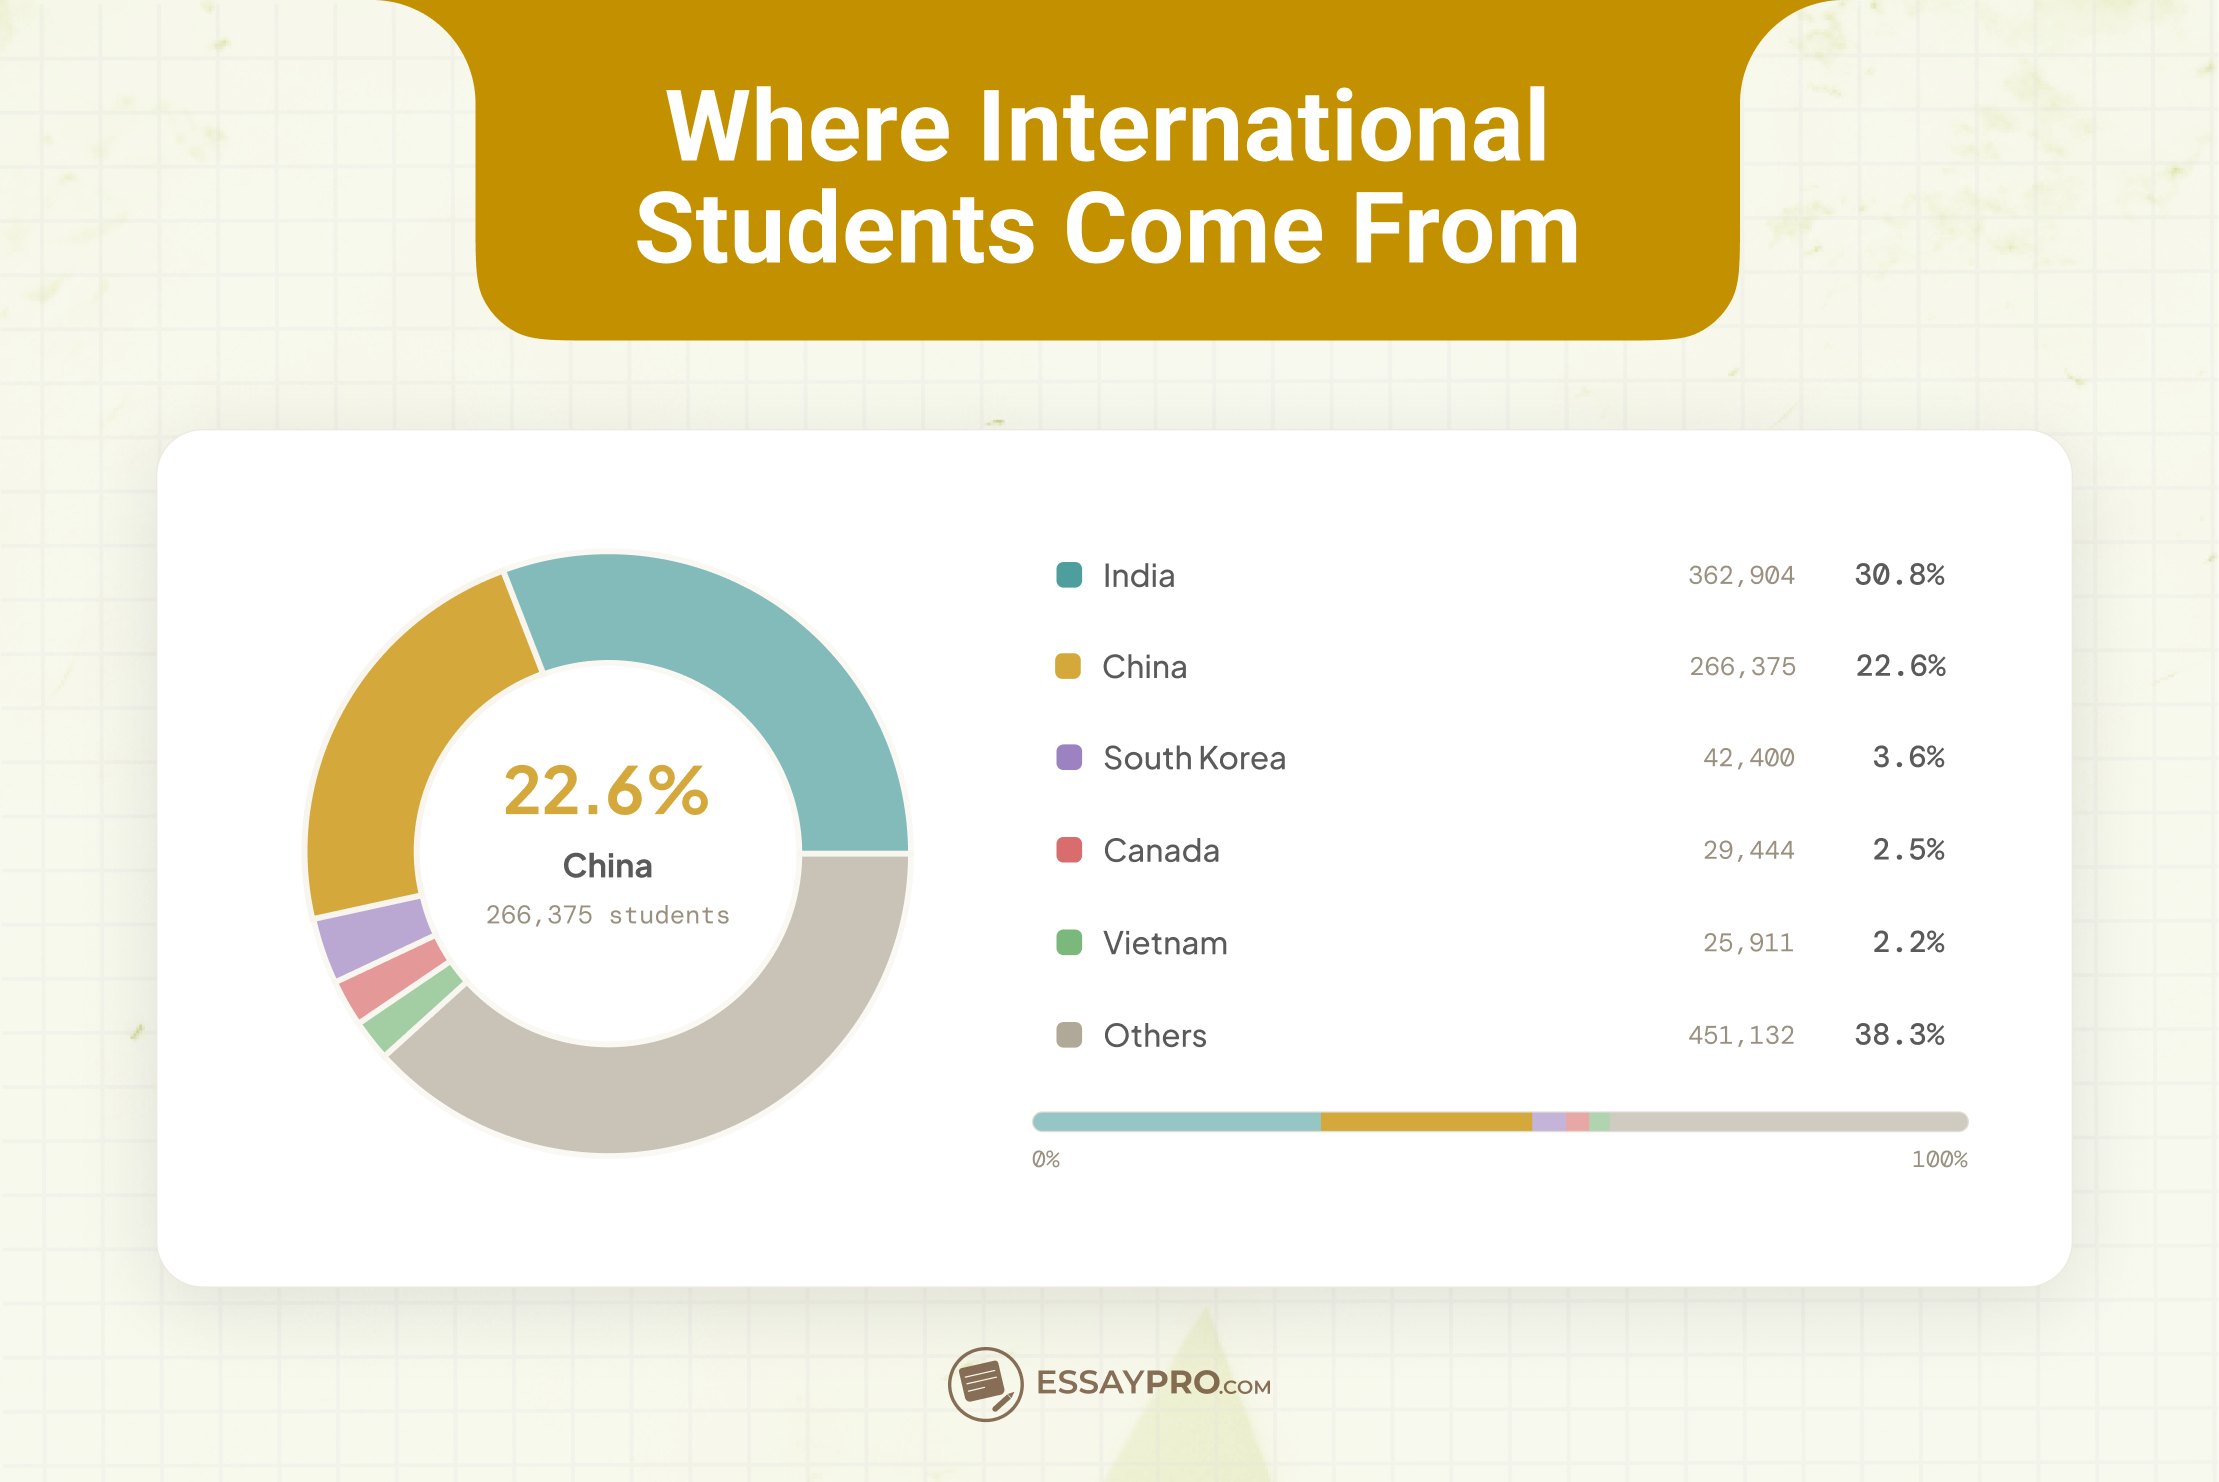
India sent 363,019 students in 2024/25, a 10% increase and the largest total of any country. China followed with 265,919, a 4% decline. South Korea remained third.
India's rise to the top happened the previous year, in the 2023/24 data, when Indian enrollment jumped 23% to 331,602 while China's fell 4% to 277,398 — ending a run at the top that China had held since 2009/10. Graduate enrollment and OPT participation drove the shift.
Twelve countries at record highs
Twelve of the top 25 sending countries reached their largest totals ever in 2024/25:
Bangladesh · Canada · Colombia · Ghana · India · Italy · Nepal · Nigeria · Pakistan · Peru · Spain · Vietnam
None approaches India or China in raw numbers. But the composition of U.S. international enrollment is broadening well beyond the two countries that dominate coverage.
What and where they study
Fields
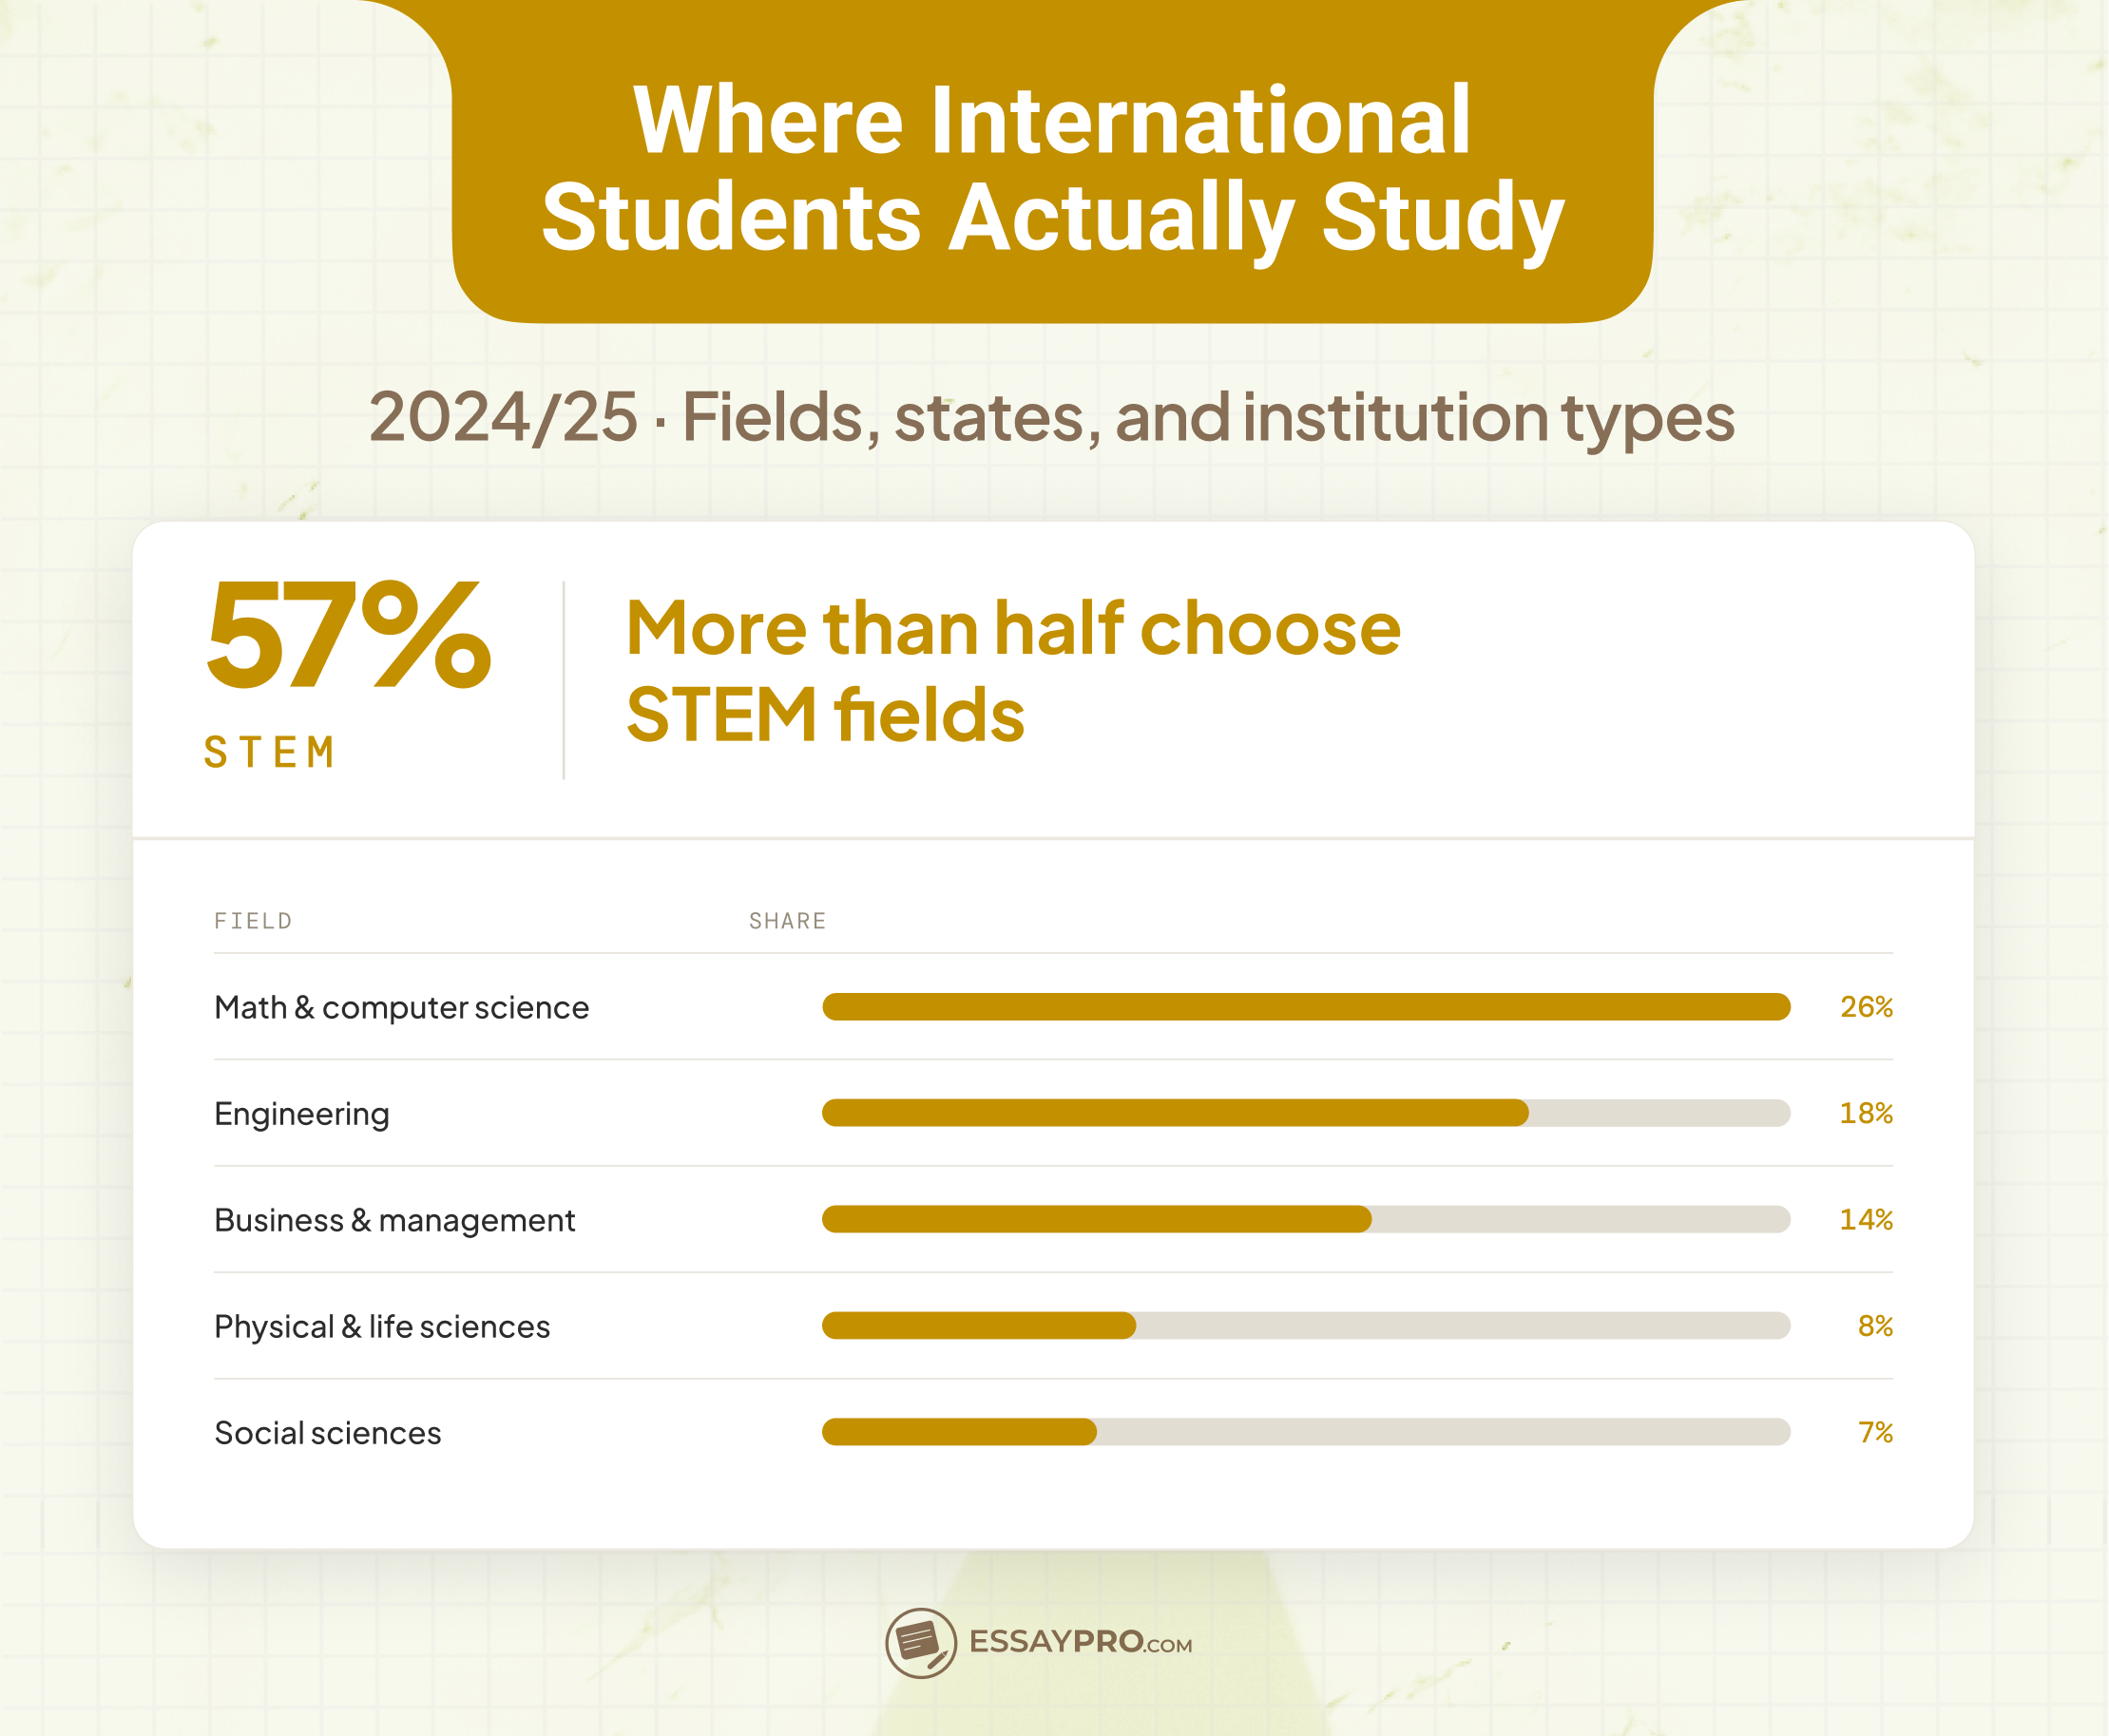
57% of international students across all academic levels pursued STEM fields in 2024/25 — the majority, and a share that has climbed steadily.
States
California, New York, and Texas hosted the largest numbers. International students were enrolled in all 50 states.

Institution types
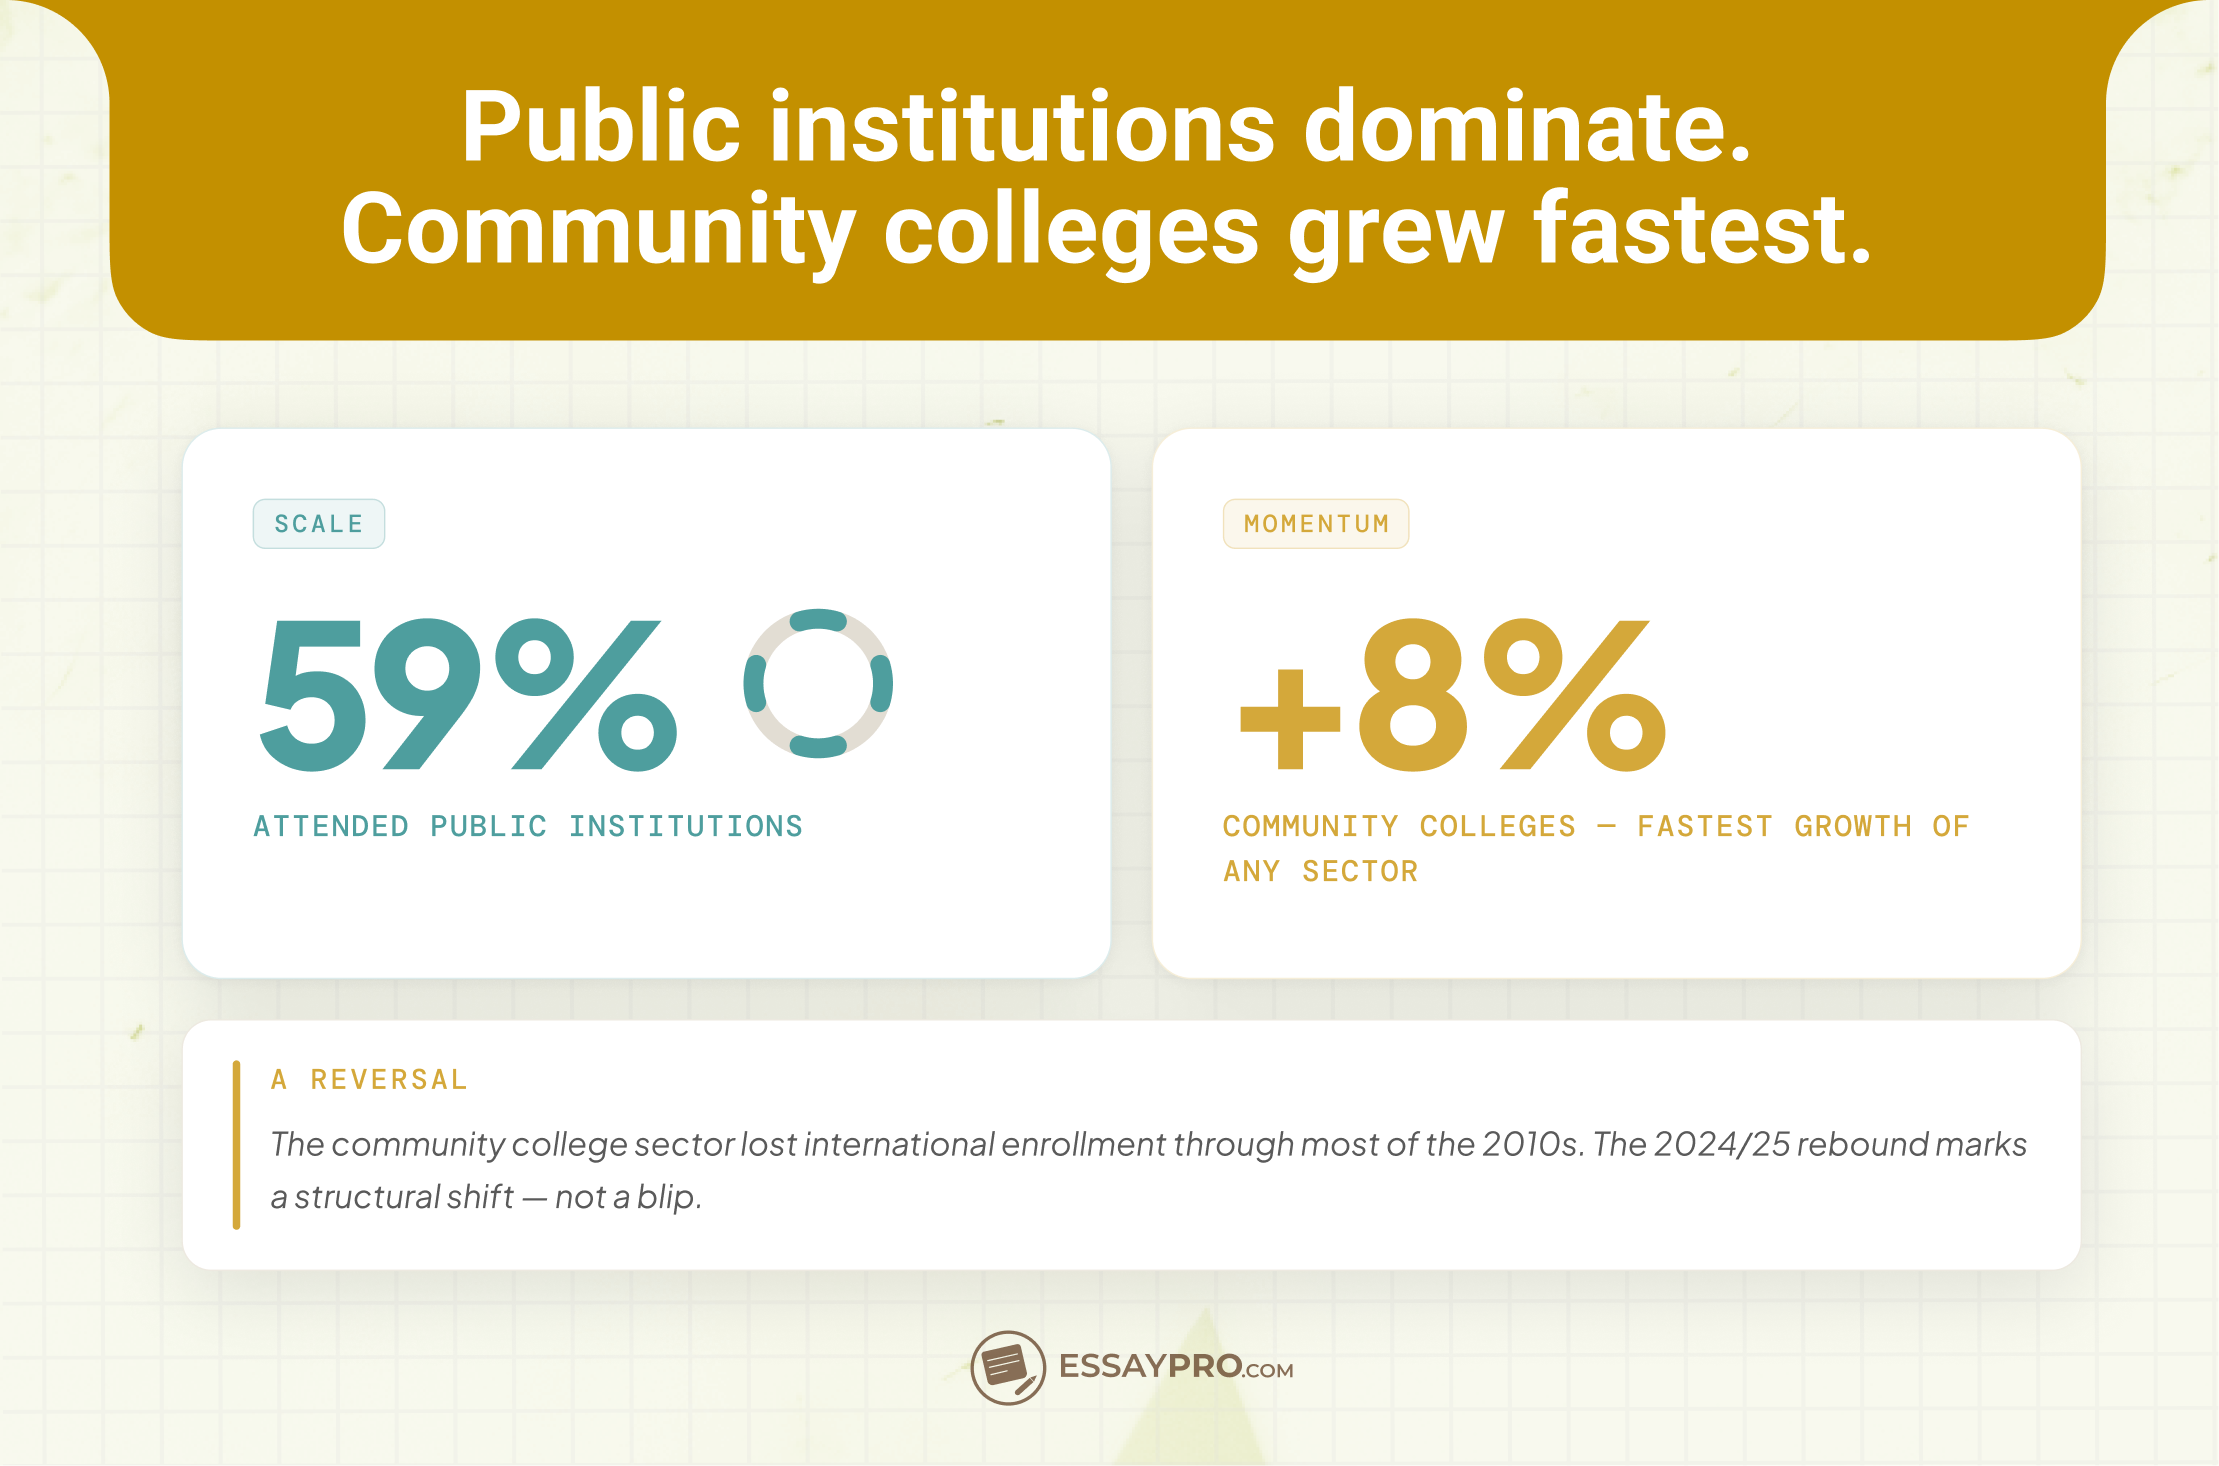
Most international students attended public institutions. The fastest growth came from community colleges — a notable shift, given that the sector had been losing international enrollment for most of the previous decade.
Economic contribution
Two credible estimates exist, and they differ by more than $12 billion, because they measure different things.
The U.S. Department of Commerce put education-related exports at nearly $55 billion for calendar year 2024. This is a trade-balance figure covering all education-related spending by foreign nationals.
NAFSA, working with JB International, estimated $42.9 billion and 355,736 jobs supported for the 2024/25 academic year — a 2% decline from the prior year's record. NAFSA's model nets out U.S.-sourced financial aid and institutional funding, which is why its figure is lower.
NAFSA's separate analysis of the fall 2025 decline projects over $1.1 billion in lost revenue and nearly 23,000 fewer jobs for the current year.
Why enrollment is falling
No single cause. Several overlapping pressures landed on prospective students inside an eighteen-month window.
The 2025 visa disruption. The State Department suspended student visa interviews from May 27 to June 18, 2025 — during the peak issuance season for fall enrollment — and resumed them with expanded social media vetting requirements. F-1 issuance fell roughly 36% worldwide from May through August 2025 against the same months in 2024, approximately 97,000 fewer visas. June was the worst month, down nearly 50% year over year. India saw issuance fall more than 60% over that summer. In the Fall 2025 Snapshot, 96% of institutions named visa application problems as an obstacle to enrollment.
H-1B fee increase. A $100,000 fee now applies to H-1B petitions filed for candidates outside the United States, effective September 21, 2025. Students changing status from F-1 to H-1B while inside the country are exempt — but the exemption has not stopped the fee from reframing the risk calculation for anyone weighing a multi-year investment in a U.S. degree.
The end of duration of status. On July 17, 2026, DHS published a final rule (91 FR 44976) eliminating open-ended "duration of status" admission for F, J, and I nonimmigrants, effective September 15, 2026. F-1 students had previously been admitted for an unspecified period and could stay as long as they remained enrolled. What changes:
- Admission is now for a fixed period capped at four years, tied to the program end date on the I-20.
- Students needing longer must file a formal extension of stay with USCIS, including for OPT and STEM OPT.
- The departure grace period drops from 60 days to 30 for students readmitted after the effective date.
The rule was proposed in August 2025 and finalized nearly a year later, meaning two full application cycles ran under unresolved rulemaking. Full compliance detail, including transition provisions for students already in D/S status, is maintained by NAFSA and DHS Study in the States.
Competitive shift, but not where you'd expect. The Global Enrolment Benchmark Survey (NAFSA, Oxford Test of English, and Studyportals; 461 universities across 63 countries, surveyed August–October 2025) found new international enrollment falling in both the U.S. and Canada, with Canada considerably worse: U.S. new undergraduate enrollment down 6% and graduate down 19%, against Canadian declines of 36% and 35%. Enrollment rose in Europe and Asia. The gainers are not the countries usually framed as America's competitors.
That survey also captured a striking shift in how institutions read their own situation: 85% of U.S. institutions named visa restrictions and government policy as a major barrier, up from 58% the year before.
Outlook for 2026/27
No confirmed figure exists for the coming cycle. What exists are early signals from different instruments, and they do not fully agree.
The gap between steep application declines (−9%) and a modest enrollment decline (−1%) is the number to watch. Applications lead enrollment by roughly a year, which means the fall 2026 intake carries the weight of the 2025 visa disruption in a way that fall 2025 only partly did. Whether that gap narrows or widens depends largely on how visa processing and the new fixed-admission rule function in practice from September onward.
Open Doors 2026, expected in November, will be the first settled source.
FAQ

How many international students are in the U.S.?
Which country sends the most international students to the U.S.?
Is international student enrollment going down?
How much do international students contribute to the U.S. economy?
What is the Open Doors report?

Ana Ratishvili
Ana is a professional literary writer with a Master’s Degree in English literature. Through critical analysis and an understanding of storytelling techniques, she can craft insightful guides on how to write literary analysis essays and their structures so students can improve their writing skills.