

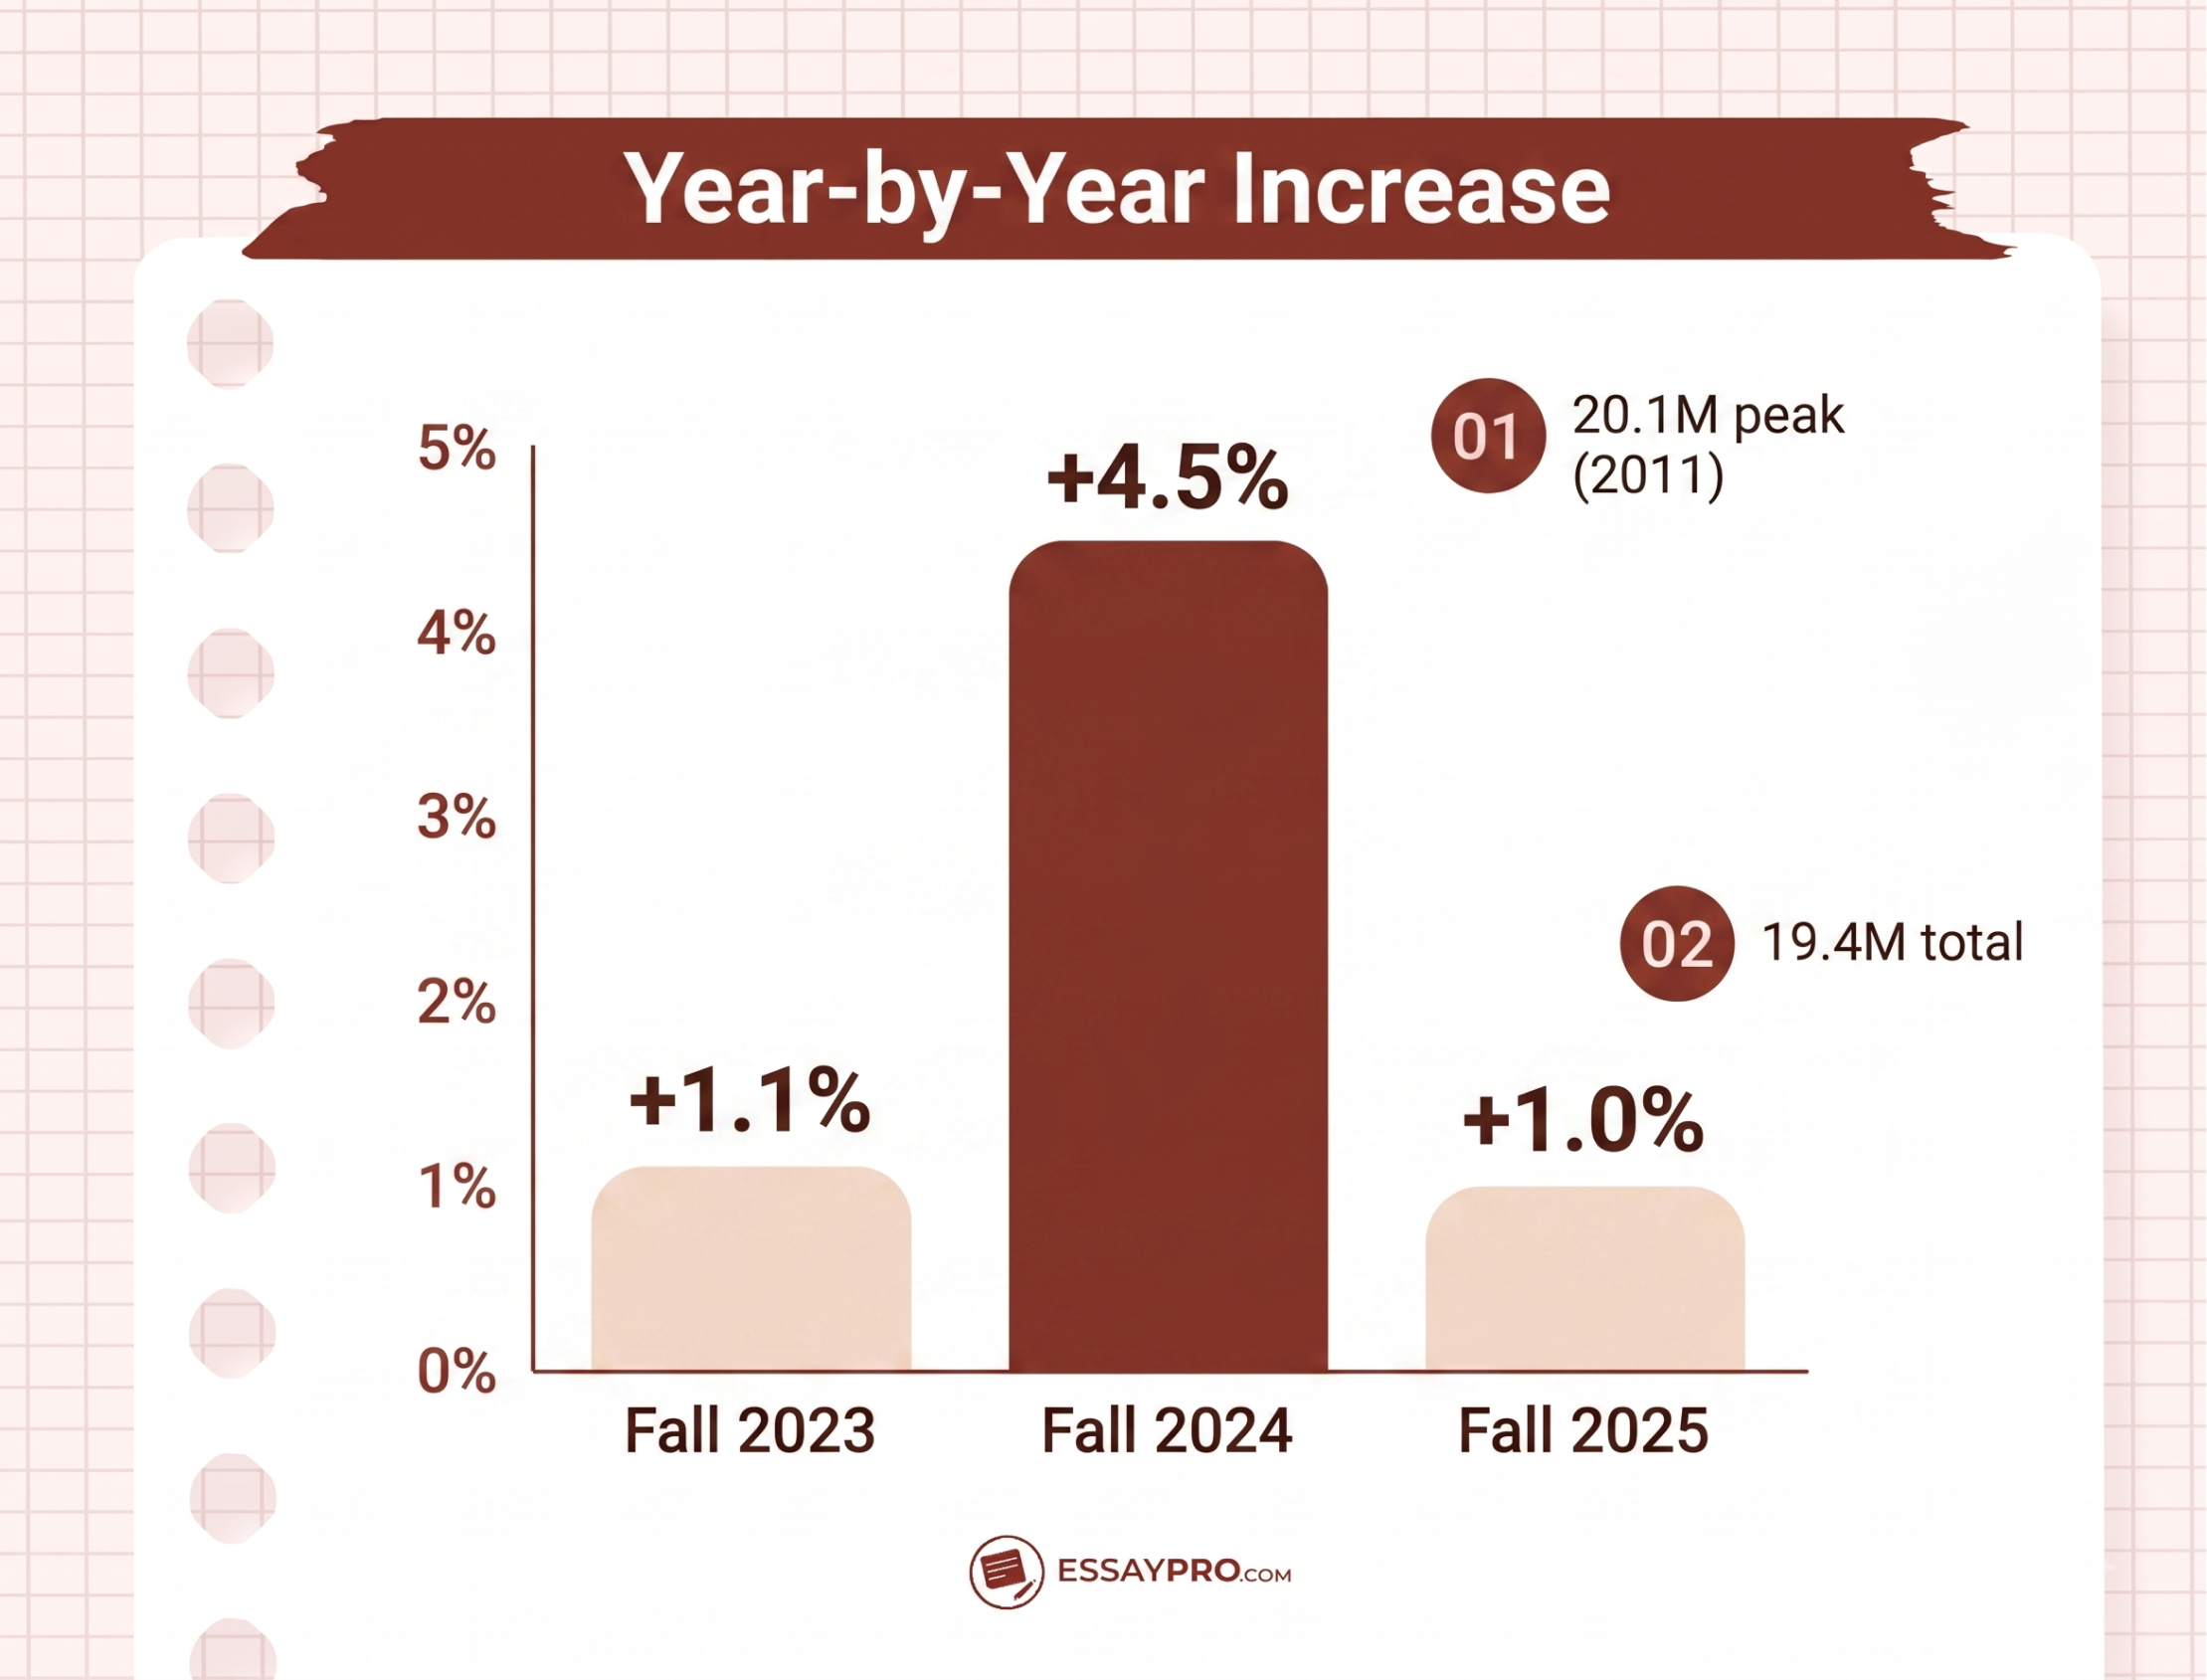
More than 19.4 million students enrolled in U.S. colleges in fall 2025, a 1.0% rise of 187,000 over the previous fall. According to the National Student Clearinghouse Research Center, spring 2026 followed the same pace, reaching 18.6 million students—up 1.0% from spring 2025. That sets fall 2025 as the third straight year of growth after a long decline, but still the weakest of the three.
- Fall 2023: +1.1%
- Fall 2024: +4.5%
- Fall 2025: +1.0%
Anyone who follows college enrollment statistics is looking at a genuine recovery that has plainly lost speed over the last twelve months. The recovery is real. Its pace has dropped hard.
The academic year in one view
Two terms, one academic year. Here is how fall 2025 and spring 2026 sit when you set them next to each other.
Set fall 2025 against the longer record, and four facts stand out:
- Total postsecondary enrollment has climbed back above its fall 2019 mark. The fall 2024 count sat 0.4% (+83,000) higher than 2019, and fall 2025 pushed past that.
- American higher education peaked in fall 2011 at 20.1 million students, then enrollment fell every year for more than a decade, from 2012 through 2023.
- At 19.4 million, current US college enrollment sits roughly 700,000 students under that record. A few more years of near 1% annual growth would erase the gap and set a new high.
- Spring totals run below fall totals by design, since some fall students finish or step away by January, so both figures describe one healthy year.
If you want to see what's actually moving, look at the sectors. Not long ago they all moved together, and they all moved down. Total enrollment fell 3.3% between 2019 and 2020, then dropped another 2.7% the year after, with community colleges hit harder than anyone. Hundreds of thousands of seats emptied out at once.
Recent college enrollment trends look nothing like that shared slide. Here is fall 2025 undergraduate movement by sector:
- Community colleges enrollment: +3.0%
- Public four-year: +1.4%
- Private nonprofit four-year: −1.6%
- Private for-profit four-year: −2.0%
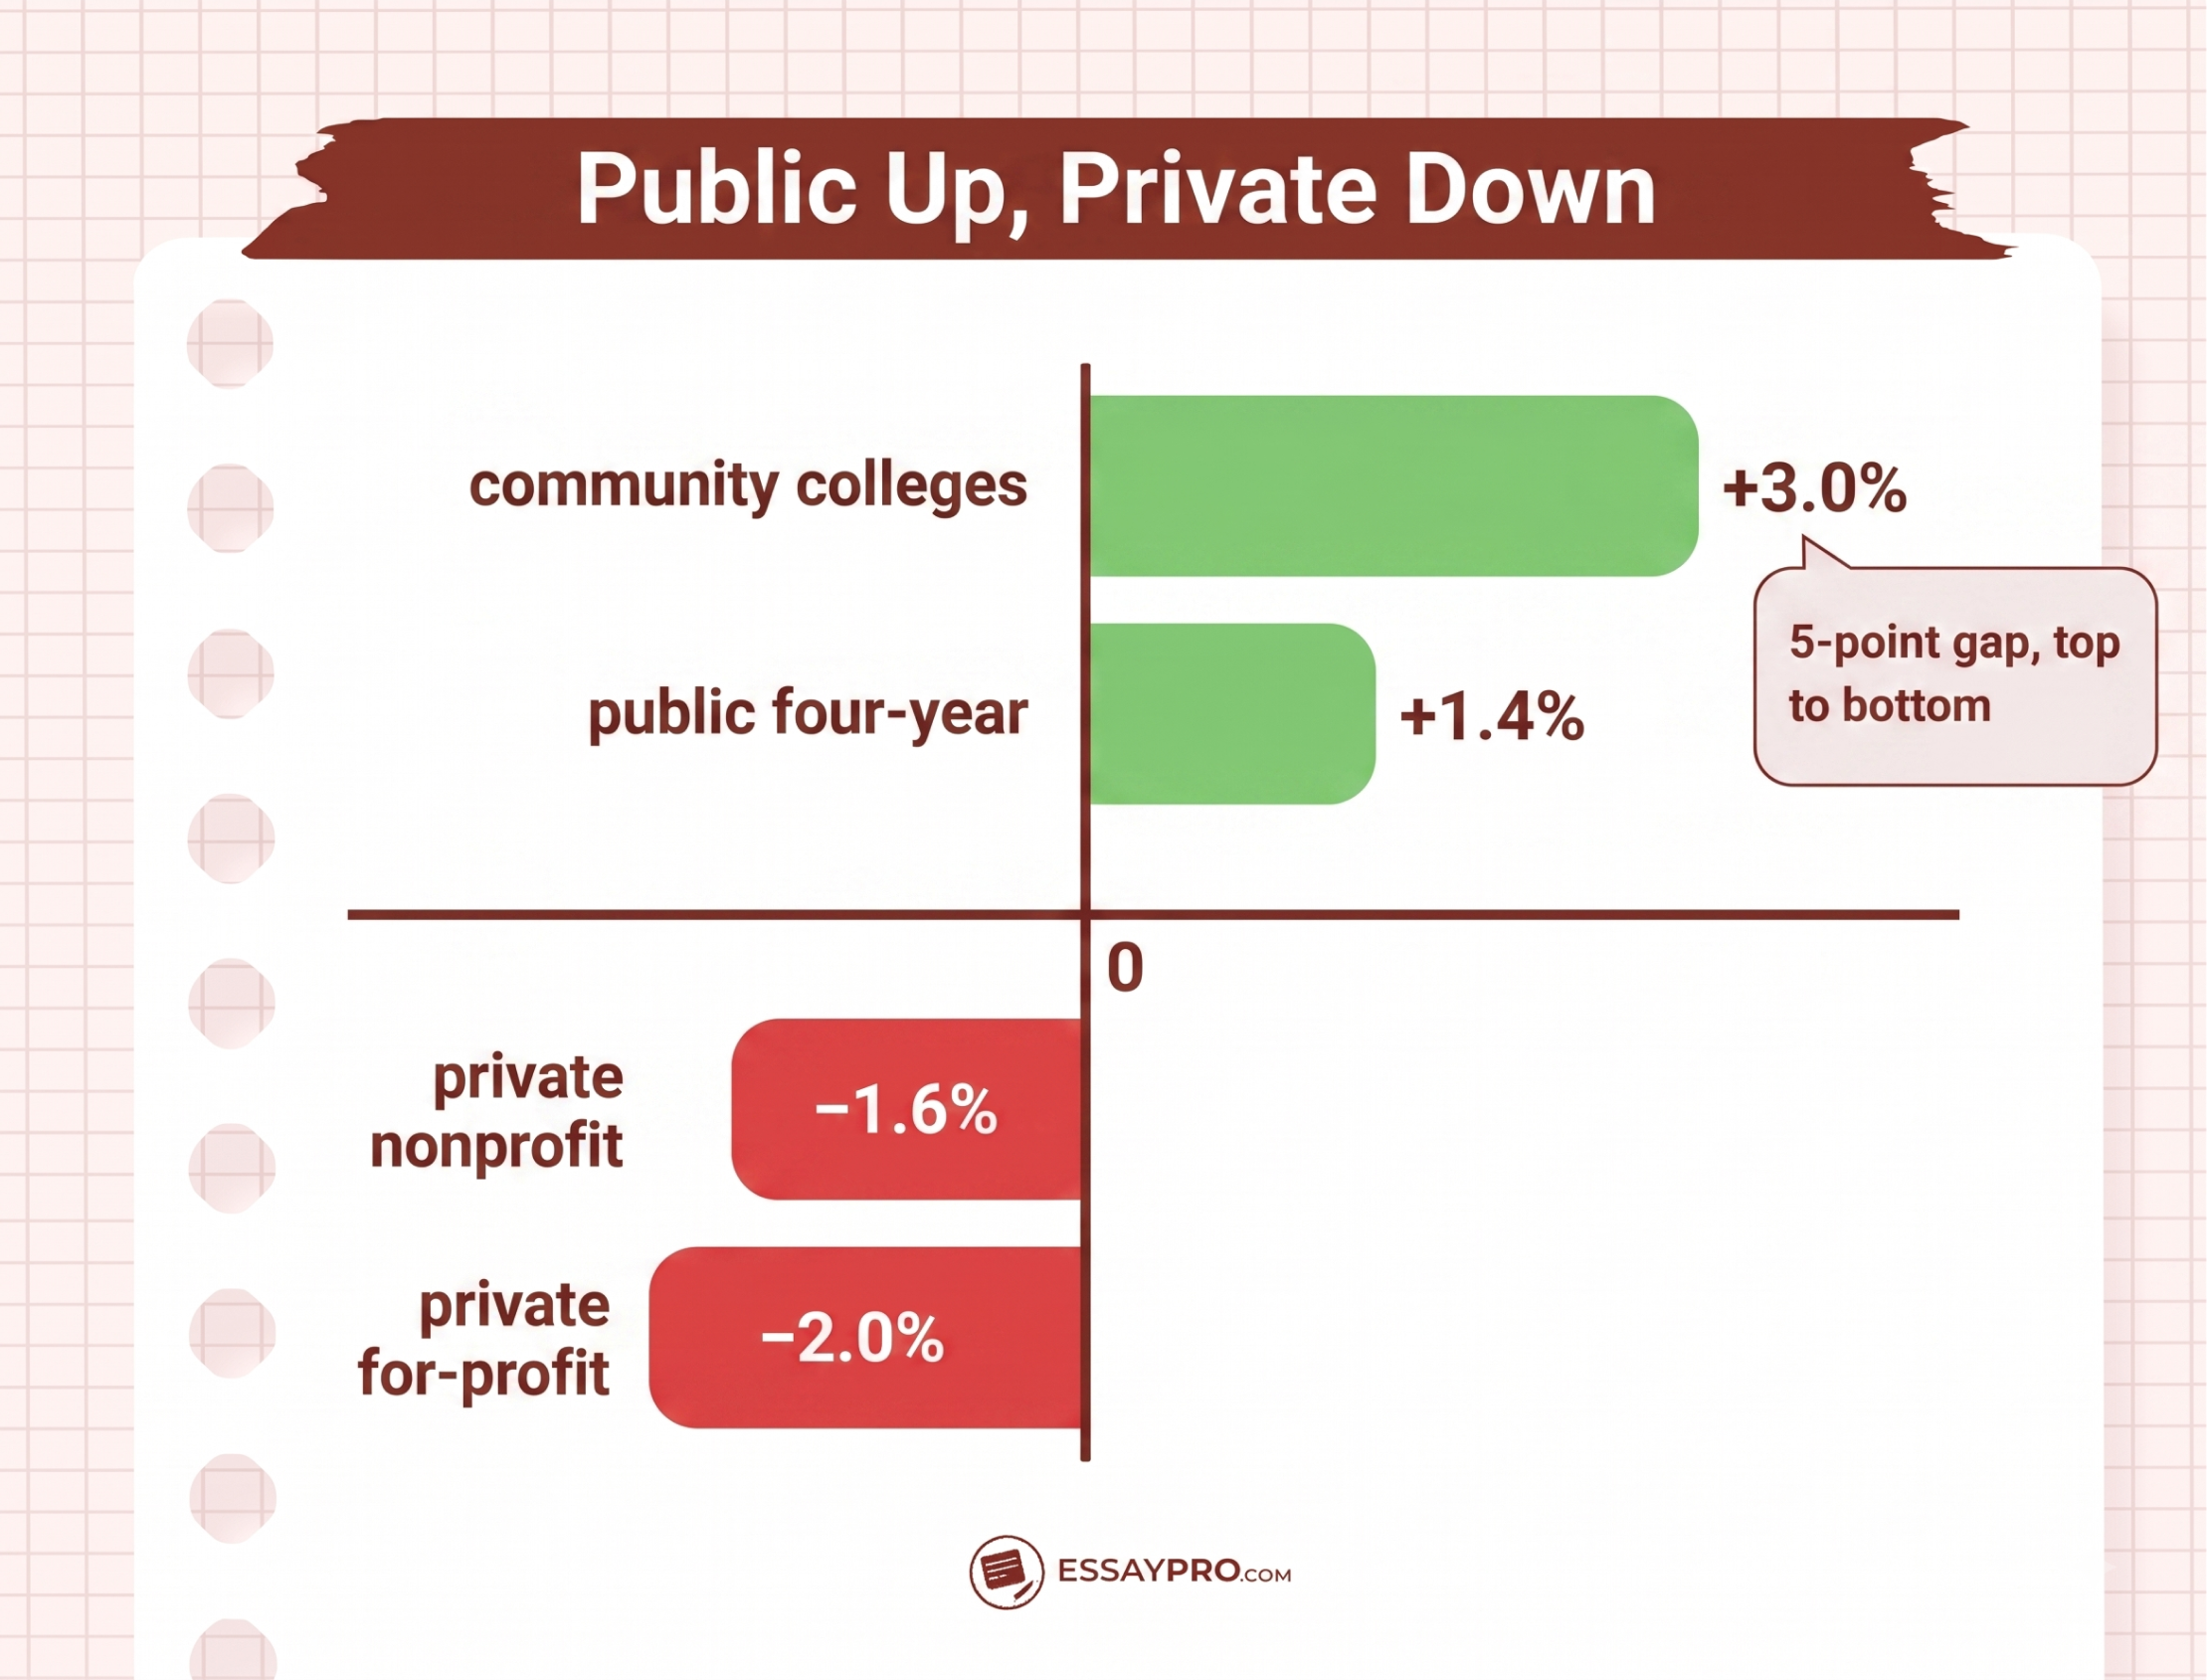
Top to bottom, that's a five-point gap. Spring 2026 came in almost identical:
- Community colleges: +3.1%
- Public four-year: +1.5%
- Private nonprofit four-year: −0.1%
- Private for-profit four-year: −0.5%
The community college turnaround is the part worth sitting with. They lost the most during the pandemic, and they're the ones bringing enrollment back:
- Fall 2024: +5.9% (+325,000)
- Spring 2025: +5.4% (+288,000)
- Spring 2026: 5.8 million students, 5.2% above spring 2021
Public and two-year schools are the ones filling seats right now. Plenty of private four-years are quietly cutting their incoming classes, and a college that's short on students has room to move on price.
By credential type
Credentials follow the same pattern, and the short programs are winning. Here's fall 2025 undergraduate growth by credential:
- Certificates: +1.9%
- Associate degrees: +2.2%
- Bachelor's degrees: +0.9%
By spring 2026 that gap got wider:
- Certificates: +10.2% (+86,000), faster than any other credential
- Associate degrees: +1.3% (+59,000)
- Bachelor's degrees: +1.0% (+85,000)
Bachelor's degrees grew the slowest of the three in both terms. The longer view is what matters for anyone who tracks Higher Education enrollment. Spring 2025 gives the cleanest comparison against 2020:
- Certificates: 20% above their 2020 level after a 4.8% year
- Associate degrees: +6.3% that spring, still under spring 2020
- Bachelor's degrees: +2.1% that spring, still under 2020
Certificates recovered everything they lost in the pandemic and then some. The degree programs were still working their way back to where they started in 2020. One number sums up the shift in student enrollment trends: community colleges now count 752,000 undergraduate certificate enrollments. That's a 28.3% jump since fall 2021, and four straight years of growth.
Graduate ernrollment and international students
Graduate numbers barely moved in fall 2025. Total graduate enrollment slipped 0.3% and held at 3.2 million students. Read the graduate enrollment statistics one layer down, though, and the softness has a clear and specific source.
The pressure came from abroad:
- Graduate international enrollment fell 5.9%, a loss of about 10,000 students.
- Undergraduate international enrollment grew 3.2% (+5,000). The prior fall it had grown 8.4% (+13,000).
- Master's programs account for nearly two-thirds of fall graduate enrollment, so any wobble there moves the entire graduate line.
Put plainly, the graduate dip is an international story, and the domestic base under it held roughly steady. Holsapple described the fall downturn as a meaningful shift after a long stretch of expansion; the Center noted international enrollment had climbed roughly 50% since fall 2020, which makes this year's reversal stand out.
Coverage of the release tied the drop to visa disruption. Inside Higher Ed reported that a temporary pause on visa appointments in spring 2025 left some students unable to secure interviews before the fall term began.
Freshmen
First-year enrollment tells a smaller version of the same sector split. Freshman enrollment came in essentially flat in fall 2025, down 0.2%, and held at 2.5 million students. The national number hides the same public/private divide that runs through the rest of the data.
Here is how the freshman class broke down by sector:
- Public four-year: +1.9% (+18,000), up to 971,000 freshmen
- Private four-year nonprofit: down about 10,000
- Private four-year for-profit: down about 10,000
- Community colleges: 965,000 freshmen, +0.5% (+4,000)
A couple of things stand out in those freshman enrollment statistics. Public four-year campuses booked the clearest gain and now sit right alongside the community college freshman total, 971,000 against 965,000. The community college figure looks tiny at +4,000, and there is a reason: it follows three consecutive years of strong freshman growth, so the sector holds a much higher base than it did a few years back.
Age groups
Age is where the trend line actually bends, and that bend is the point. Adults in their twenties were the slowest group to come back after the pandemic. This cohort drove a large share of the pre-2020 enrollment base, and it kept shrinking even as younger students began to return.
Spring 2025 is where the reversal shows up in the data:
- Ages 21–24: +3.2%
- Ages 25–29: +5.9%
Both of those marked the first real recovery for twenty-something adults after several straight years of post-pandemic decline. The reversal itself is the signal. A group that had been a steady drag on the totals turned into a source of growth, and it did so at community colleges and public campuses first.
Why care about a single age band? Because these are the students who fill evening classes, online sections, and workforce certificate programs. When they come back, community colleges feel it fastest, and the sector data you saw earlier starts to make sense.
By state
A national average falls apart the second you cross a state line. That is where the State Higher Education Executive Officers Association, SHEEO, earns its keep. Its State Higher Education Finance report tracks public full-time-equivalent enrollment, which converts credit hours into full-time student slots. Headcount counts every enrolled student, so these totals sit lower than the headcount figures earlier in this piece. Here is the 2025 picture for public higher-education FTE enrollment by state:
- Public FTE enrollment rose 3.6% (+378,895 students), for a national total of 10.8 million
- 44 states and Washington, D.C. posted gains
- Wyoming posted the biggest jump at +15.4%
- Colorado sat at the bottom of the winners, up just 0.1%
- The remaining six states did not gain ground
- Two-year schools grew 5.0%, four-year campuses 2.8%
The national total still sits 1.3% below its 2019 level and 7.2% under the 2011 peak. So before you commit anywhere, look up your own state. A campus in a +15% market recruits you on very different terms. Read your state's trend before you read a single brochure.
Enrollment intensity: full-time vs part-time
Full-time enrollment still holds the majority, and part-time is the piece that ties back to the sector split. For a federal read here, step over to the National Center for Education Statistics, whose IPEDS data breaks enrollment down by attendance status and by public or private control.
The structural picture:
- Roughly 60% of undergraduates attend full-time, and about 40% attend part-time
- At community colleges, the split sits near 50/50
- Part-time enrollment nationally was 7.4 million in 2020, and NCES projects it near 8.1 million by 2030
Now connect it to the inversion. Part-time students cluster in public two-year schools, and private nonprofit four-years lean heavily full-time. The fall 2025 growth ran through community colleges, the most part-time sector, and the private four-years now losing students lean the most full-time. So the inversion holds, and part-time enrollment is riding it.
Major field
Pick a major and the fall 2025 data sorts fields into two piles: the ones adding students and the ones losing them. Computing is losing, and it is losing at every level.
Computer and Information Science fell across the board:
- Undergraduate at four-year schools: -8.1%, down to about 606,000 students
- Graduate: -14.0%, down to about 190,000 students
- Primarily associate-granting institutions: -3.6%
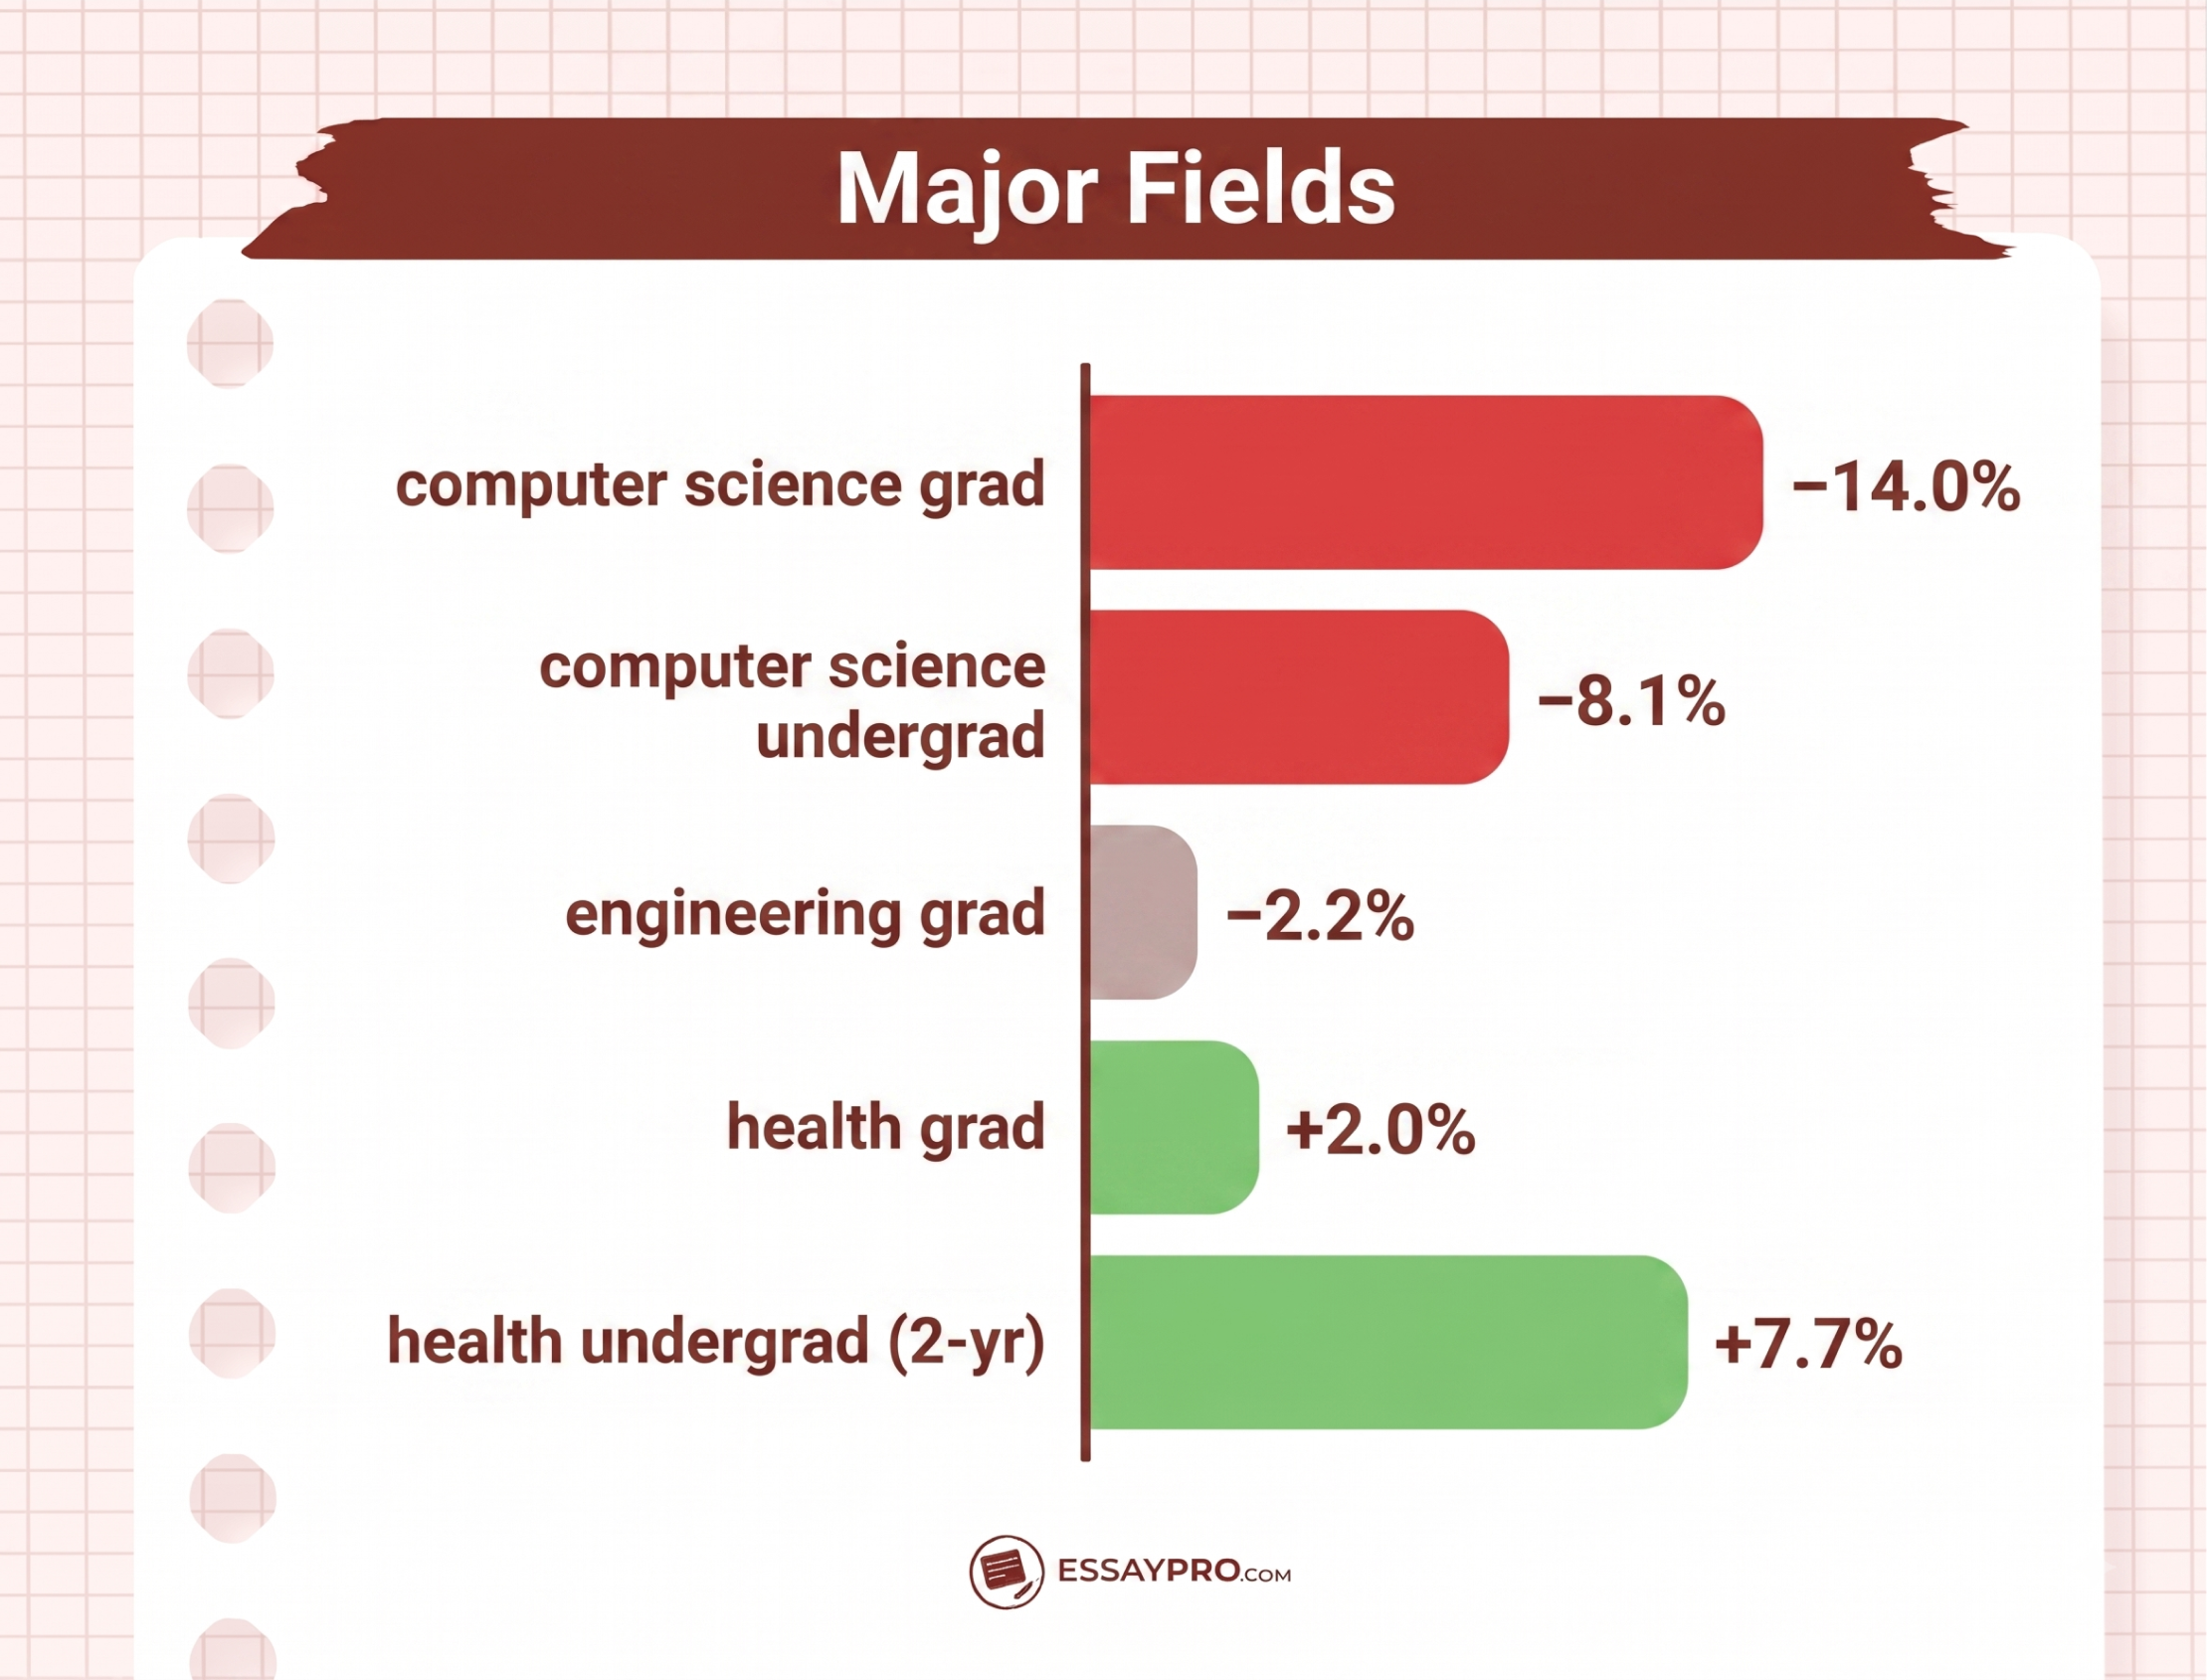
Health and engineering gained instead. The numbers on college enrollment by major make the split obvious:
- Health professions, graduate: +2.0%, up to 760,900 students
- Health professions, undergraduate at two-year schools: +7.7% (+59,800), which brought total undergraduate health enrollment to 2.1 million
- Undergraduate engineering: gains across every institution level
- Graduate engineering: -2.2%
One caveat is worth reading correctly. Students are not fleeing tech. Data Science and Data Analytics programs reached nearly 80,000 students by fall 2025 and kept climbing. The shift is toward applied, workforce-ready skills. So if you are choosing a lane, health and hands-on engineering are the fields adding students right now, and traditional computer science is not.
Predictions
Numbers hold up better than baseless predictions, so here are the ones that matter. The fall 2025 trajectory pointed to a spring 2026 near 1%, and that is what landed: 18.6 million students, up 1.0%. Growth has settled into a tight band. Fall 2023 ran +1.1%, fall 2024 +4.5%, fall 2025 +1.0%.
Hold that 1% pace and the arithmetic is simple. Total enrollment reaches roughly 19.6 million in 2026, 19.8 million in 2027, and about 20.2 million in 2029, which would finally clear the 2011 peak of 20.1 million.
One number caps the optimism. Projections from the Western Interstate Commission for Higher Education put high school graduates at a 3.9 million peak in 2025. Their projection puts the count below 3.4 million by 2041. The pipeline is shrinking.


Ana Ratishvili
Ana is a professional literary writer with a Master’s Degree in English literature. Through critical analysis and an understanding of storytelling techniques, she can craft insightful guides on how to write literary analysis essays and their structures so students can improve their writing skills.