
Key takeaways
- Email still pays off. UK marketers report about £41 back for every £1 spent, before adjusting for inflation.
- The audience is huge and spans ages. Radicati forecasts 4.73 billion email users in 2026, and in the EU, use peaks at 92.2% among 20- to 24-year-olds.
- Opens can mislead. Apple’s privacy feature affects roughly 55-60% of opens, so clicks and revenue are better measures.
- Phones set the rules. Mobile is the main place people read email, and Apple and Gmail account for nearly 90% of opens.
- Automation and relevance win. Automated emails are 2% of sends but 30% of email revenue, yet only 26% of UK emails are segmented.
- Email and social work best together. Use social to reach people and email to convert and keep them.
Top email marketing statistics you must know in 2026-27 📧
- Almost £41 back for every £1 spent. UK marketers estimate email ROI at almost £41 per £1, up from about £38 in the previous edition (DMA Marketer Email Tracker, 2026).
- About a fifth of marketing budgets. Email takes roughly 20% of total marketing spend, and 66% of marketers expect their email budget to grow over the next 12 months (DMA, 2026).
- 4.73 billion email users. Radicati forecasts this figure for 2026, up from 4.48 billion in 2024, when more than half of the world’s population used email (Radicati Group).
- 392.5 billion emails a day. This is Radicati’s 2026 forecast, up from 376.4 billion in 2025 and 361.6 billion in 2024 (Radicati Group).
- 9.8 billion daily emails in the US. In August 2025, the US had the highest daily email volume of any country (Statista).
- 251 million emails every minute. At the end of 2024, that was roughly five times the number of instant messages exchanged (Statista).
- 98% delivery rate. UK email delivery rose to 98% in 2024, with B2C reaching 99.2% (DMA Email Benchmarking Report, 2025).
- 43.5% open rate and a record 2.5% click rate. In 2025, UK opens rose from 35.9% in 2024, and unique clicks rose from 2.3% (DMA Email Benchmarking Report 2026, as summarized by SAP Engagement Cloud).
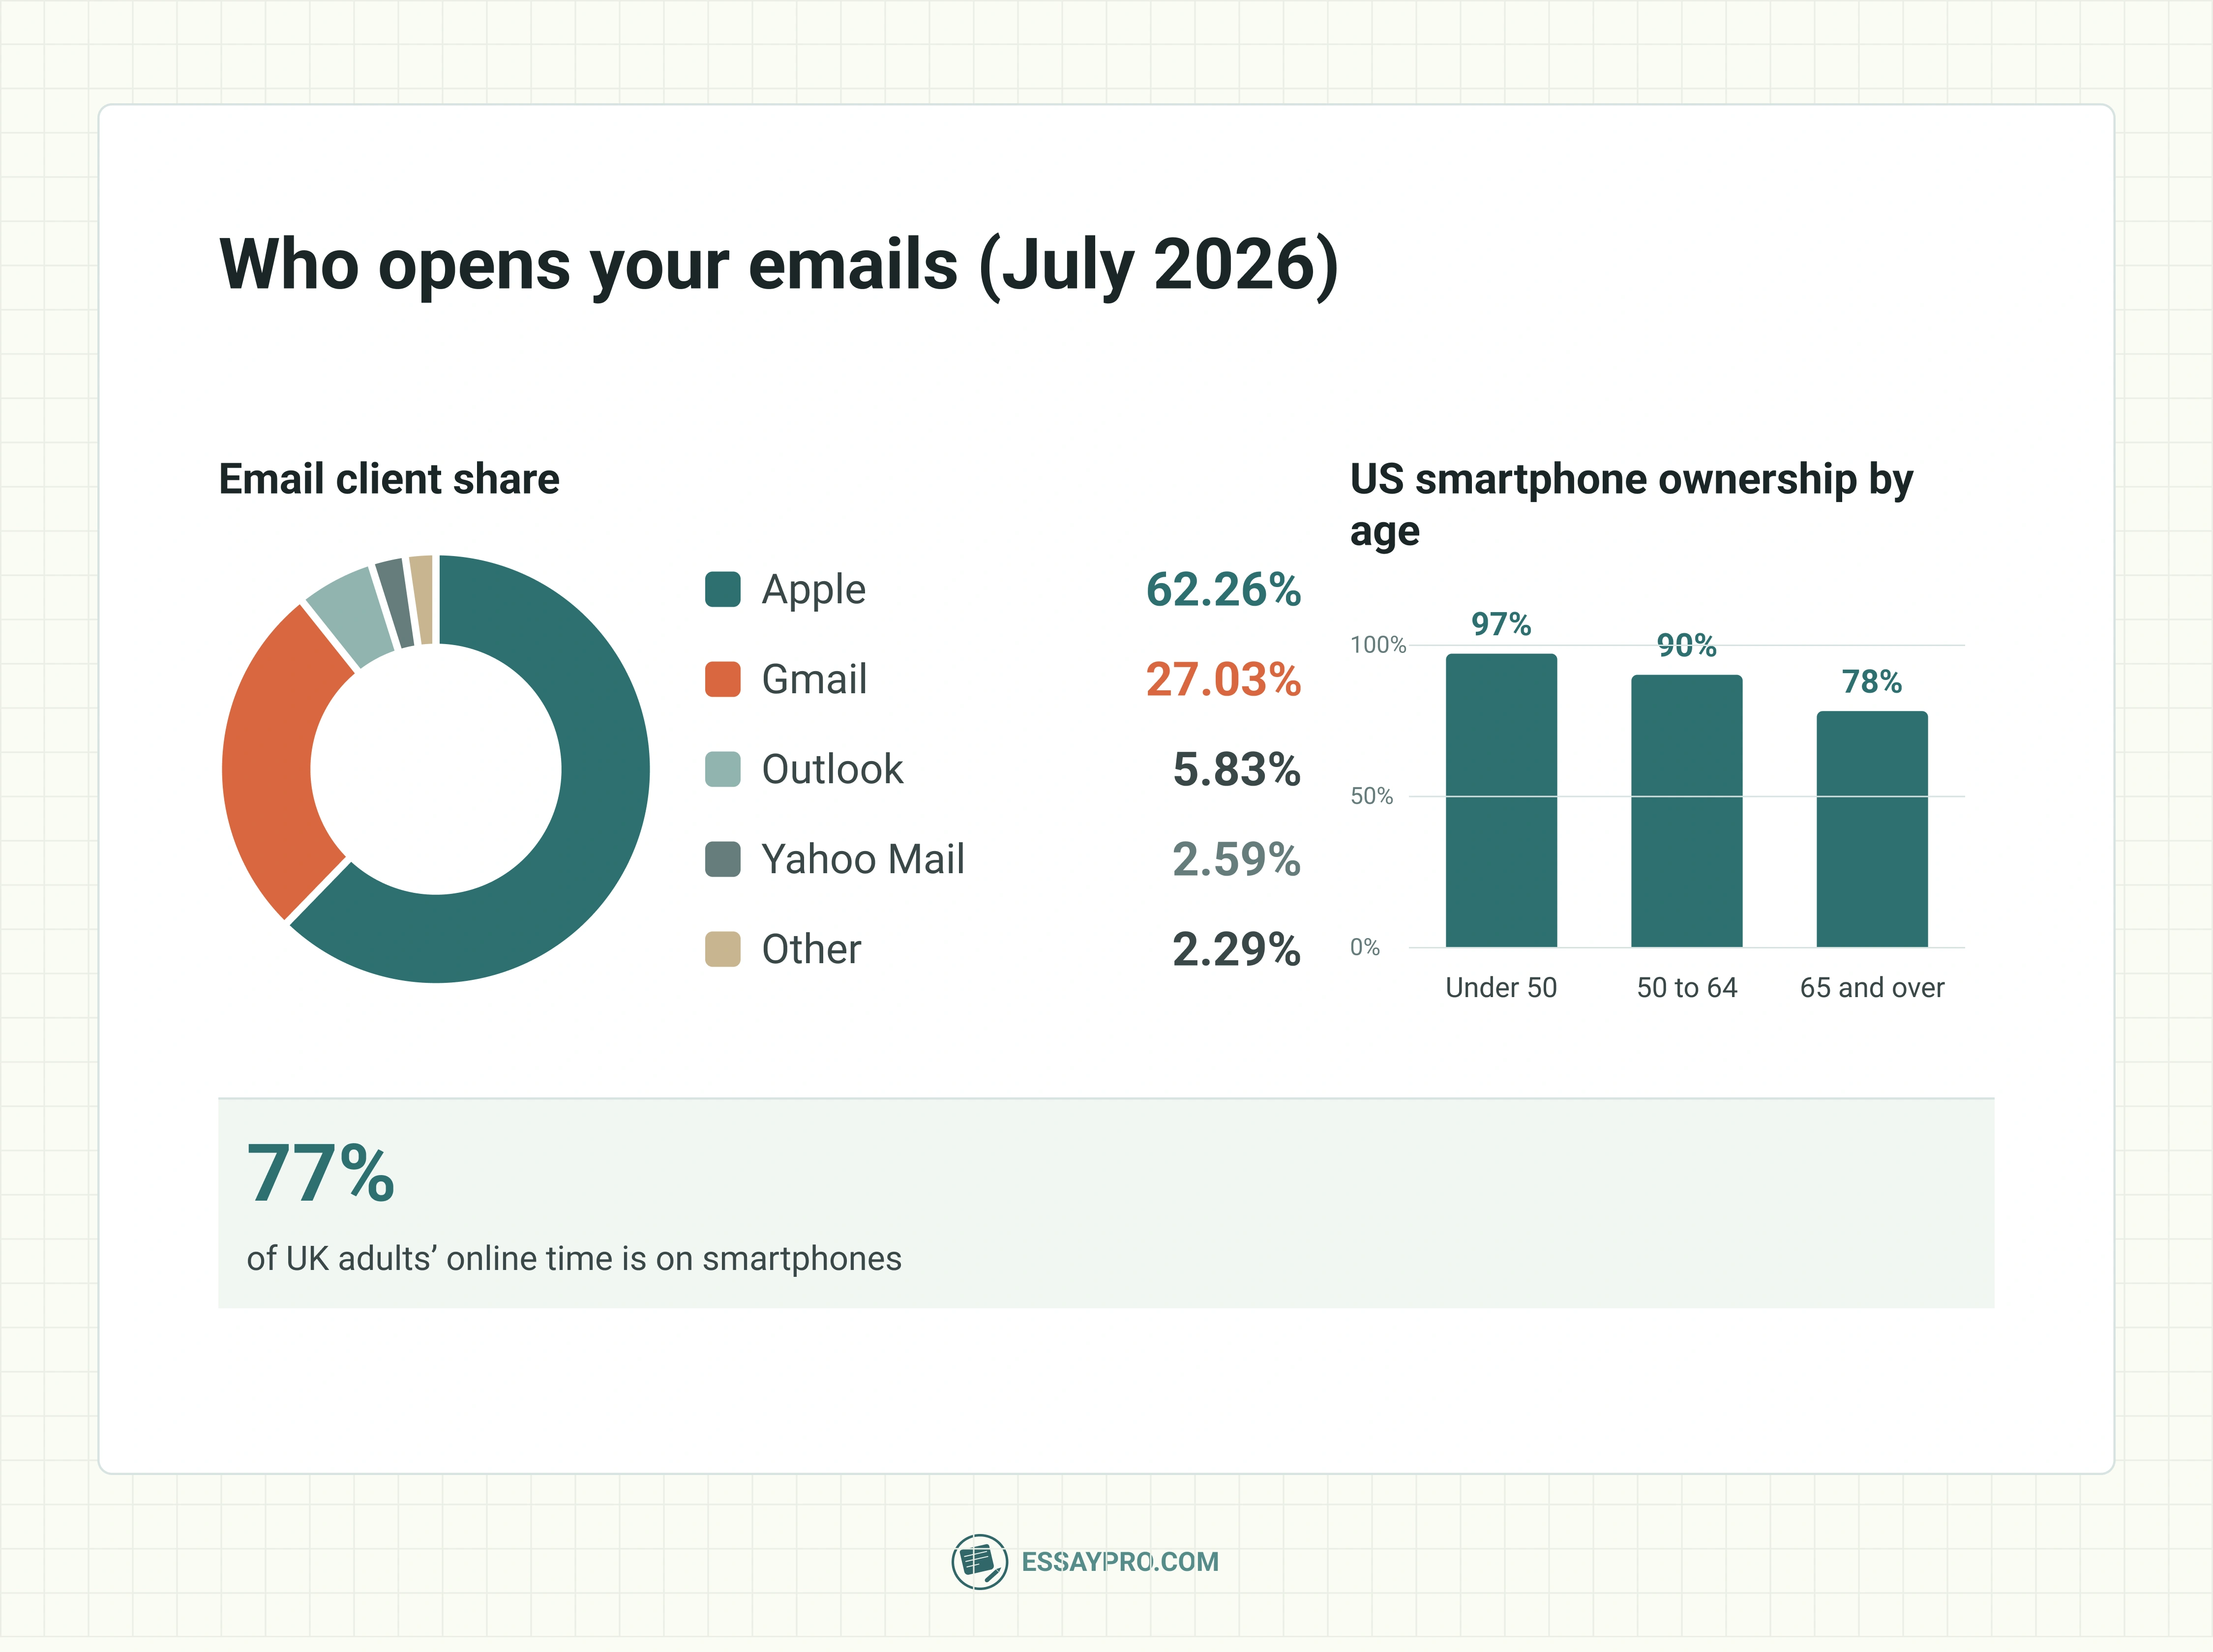
- Apple and Gmail take nearly 90% of opens. In July 2026, Apple held 62.26% and Gmail 27.03% (Litmus).
- 55-60% of opens are privacy-impacted. Litmus estimates Apple’s Mail Privacy Protection affects roughly this share, so clicks are a safer measure than opens (Litmus).
- 75% more likely to reach an ROI above 45:1. Advanced AI adopters beat other email teams, and 36% of high-ROI teams report advanced AI adoption (Litmus, State of Email 2026).
- 76% of teams send within three days. By 2026, that share deploys an email within three days, compared with 62% of teams that took two weeks or more in 2024 (Litmus).
B2B email marketing statistics
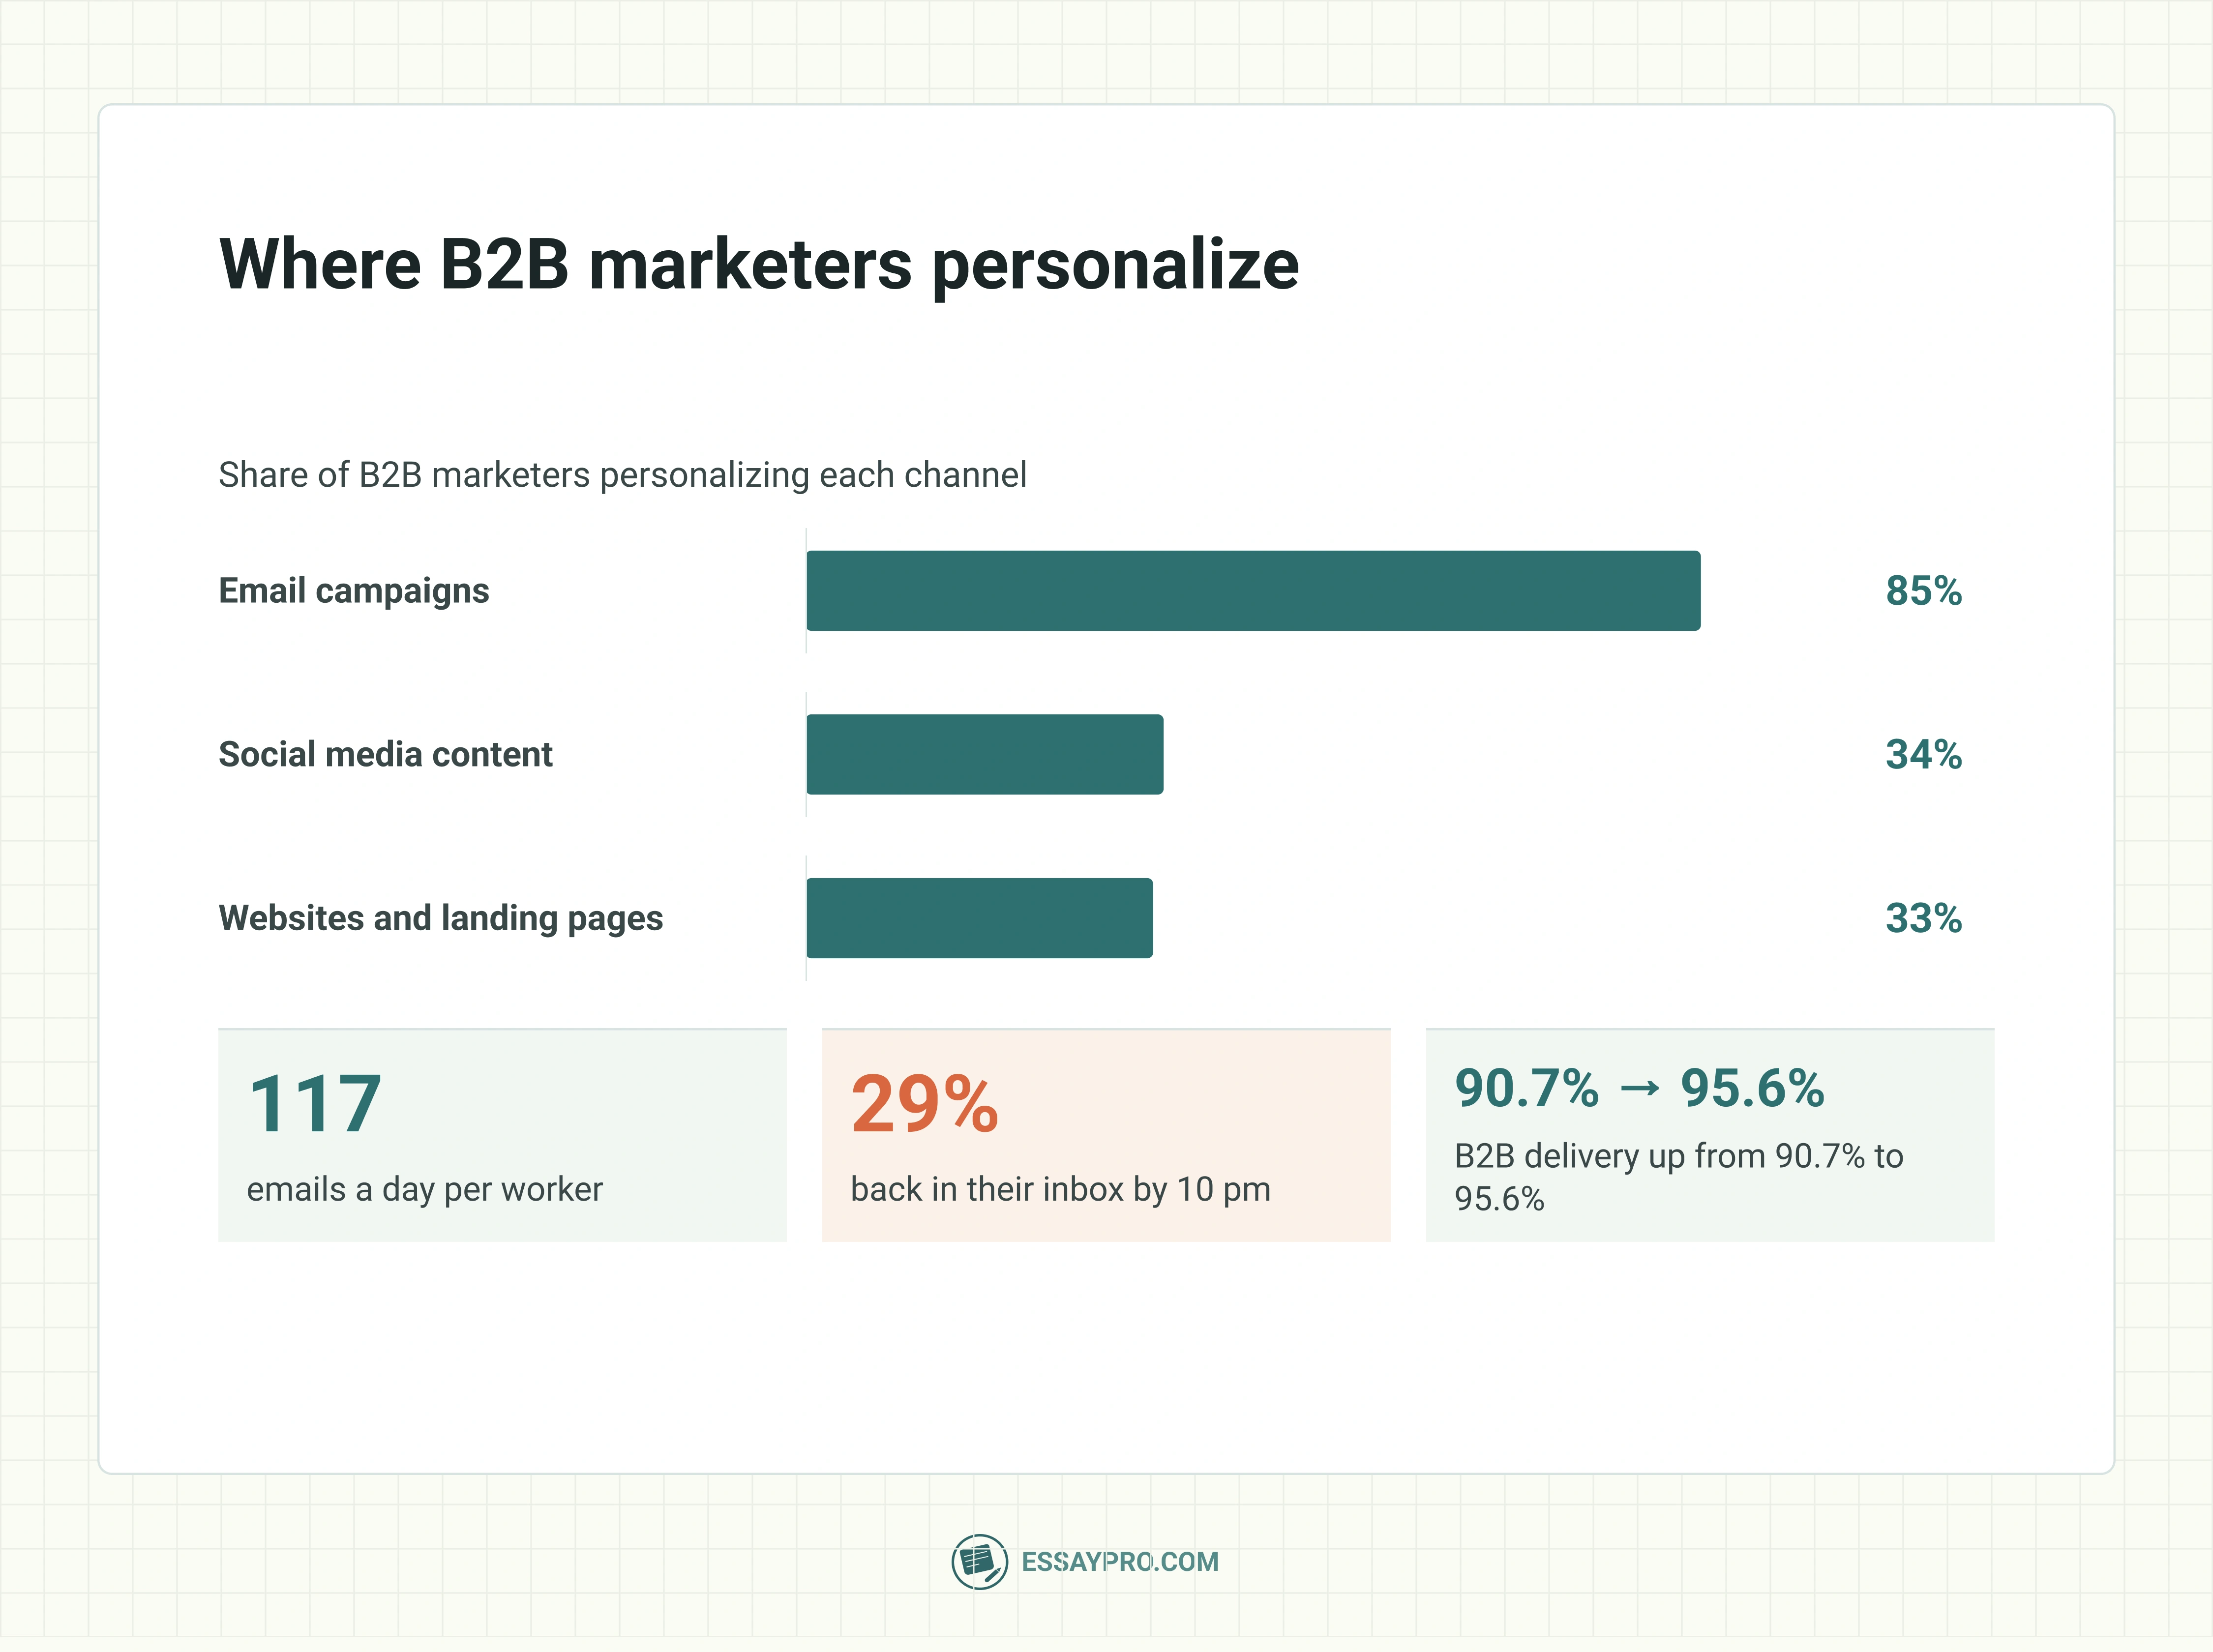
- B2B delivery climbed from 90.7% to 95.6%. This was the sharpest improvement of any segment in the DMA’s 2026 benchmarking, but it still trails the 99.2% delivery rate for all email.
- 54% rank email newsletters among their most effective thought leadership channels. They sit behind LinkedIn (76%) and ahead of speaking events and webinars (52%) in a survey of 1,015 B2B marketers, mostly in North America (Content Marketing Institute, 2026).
- 85% use personalization in email campaigns. B2B marketers personalize most often in email, ahead of social media content (34%) and websites or landing pages (33%) (Content Marketing Institute, 2026).
- 117 emails a day. The average Microsoft 365 worker receives this many, and most are skimmed in under 60 seconds (Microsoft Work Trend Index, 2025).
- Teams overtakes email by 8 am. For these workers, Microsoft Teams becomes the main communication channel early in the day, so B2B email competes for attention from the start (Microsoft Work Trend Index, 2025).
- 29% are back in their inboxes by 10 pm. Nearly a third of active workers return to email late in the evening (Microsoft Work Trend Index, 2025).
- Top programs send newsletters and onboarding emails. The top 8% of programs, those with an ROI of 45:1 or more, most commonly send these two types (Litmus, State of Email 2026).
Email marketing statistics
- 87% of EU internet users use email. That share sent or received emails in 2025, when 94% of people in the EU were online (Eurostat).
- 58% of UK online adults use Gmail. Its reach rose from 51% in 2023 and 55% in 2024 (Ofcom Online Nation, 2025).
- 8% of UK adults’ latest online harm happened on email. The share is 14% among adults aged 55 and over (Ofcom Online Nation, 2025).
- 91% of US adults own a smartphone. Nine in ten use the internet daily (Pew Research Center, 2026).
- 30% of US adults get news from email newsletters at least sometimes. That includes 6% who do so often and 24% sometimes, while 43% never do (Pew Research Center, 2026).
- Only 3% prefer newsletters as their news source. In the past year, 7% paid or donated to a news newsletter (Pew Research Center, 2026).
- Age makes little difference. Newsletter news use is 28% for ages 18 to 29, 31% for 30 to 49, 32% for 50 to 64, and 31% for 65 and over (Pew Research Center, 2026).
- Education and income matter more. 35% of college graduates and 38% of upper-income adults get news from newsletters, versus 25% with a high school education or less and 27% of lower-income adults (Pew Research Center, 2026).
- Black and Asian adults lead at 40% each. White adults are at 29% and Hispanic adults at 24%. Estimates for Asian adults cover English speakers only (Pew Research Center, 2026).
- 71% of newsletter readers subscribe to fewer than five. Only 3% subscribe to more than 10 (Pew Research Center, 2026).
- 62% don’t read most of the newsletters they receive. The other 38% read most of them, in part or in full (Pew Research Center, 2026).
- Over 25% use dark mode. More than a quarter of email users read in dark mode, so emails need to look right in both modes (Litmus).

Mobile email marketing statistics
- Mobile is still the main place people read email. Litmus says mobile devices remain the primary reading environment for most subscribers (Litmus, July 2026).
- Apple takes 62.26% of opens, Android’s own mail app just 1.45%. The Apple figure covers iPhone, iPad, Apple Mail, and Mail Privacy Protection opens. Many Android users read in Gmail’s app, which Litmus counts under Gmail (27.03%) (Litmus, July 2026).
- 77% of UK adults’ online time is on smartphones. That is up from 75% a year earlier, in a day where adults spend 4 hours 30 minutes online (Ofcom Online Nation, 2025).
- Young adults live on their phones. UK adults aged 18 to 24 spend about 5 hours 5 minutes a day on smartphones, or 81% of their online time (Ofcom Online Nation, 2025).
- Women spend more of their online time on phones. The smartphone share is 79% for women and 75% for men (Ofcom Online Nation, 2025).
- 97% of US adults under 50 own a smartphone. The share is 90% for ages 50 to 64 and 78% for those 65 and older (Pew Research Center, 2026).
- 16% of US adults rely on a smartphone for internet. These “smartphone-dependent” adults have a phone but no home broadband, up from 8% in 2013 (Pew Research Center, 2026).
- Mobile-only reading is far more common in some groups. The share is 27% of adults aged 18 to 29, 28% of Hispanic adults, and 34% of households earning under $30,000, versus 4% of those earning $100,000 or more (Pew Research Center, 2026).
- 86.3% of EU residents used a phone to go online in 2023.
Email open rate statistics
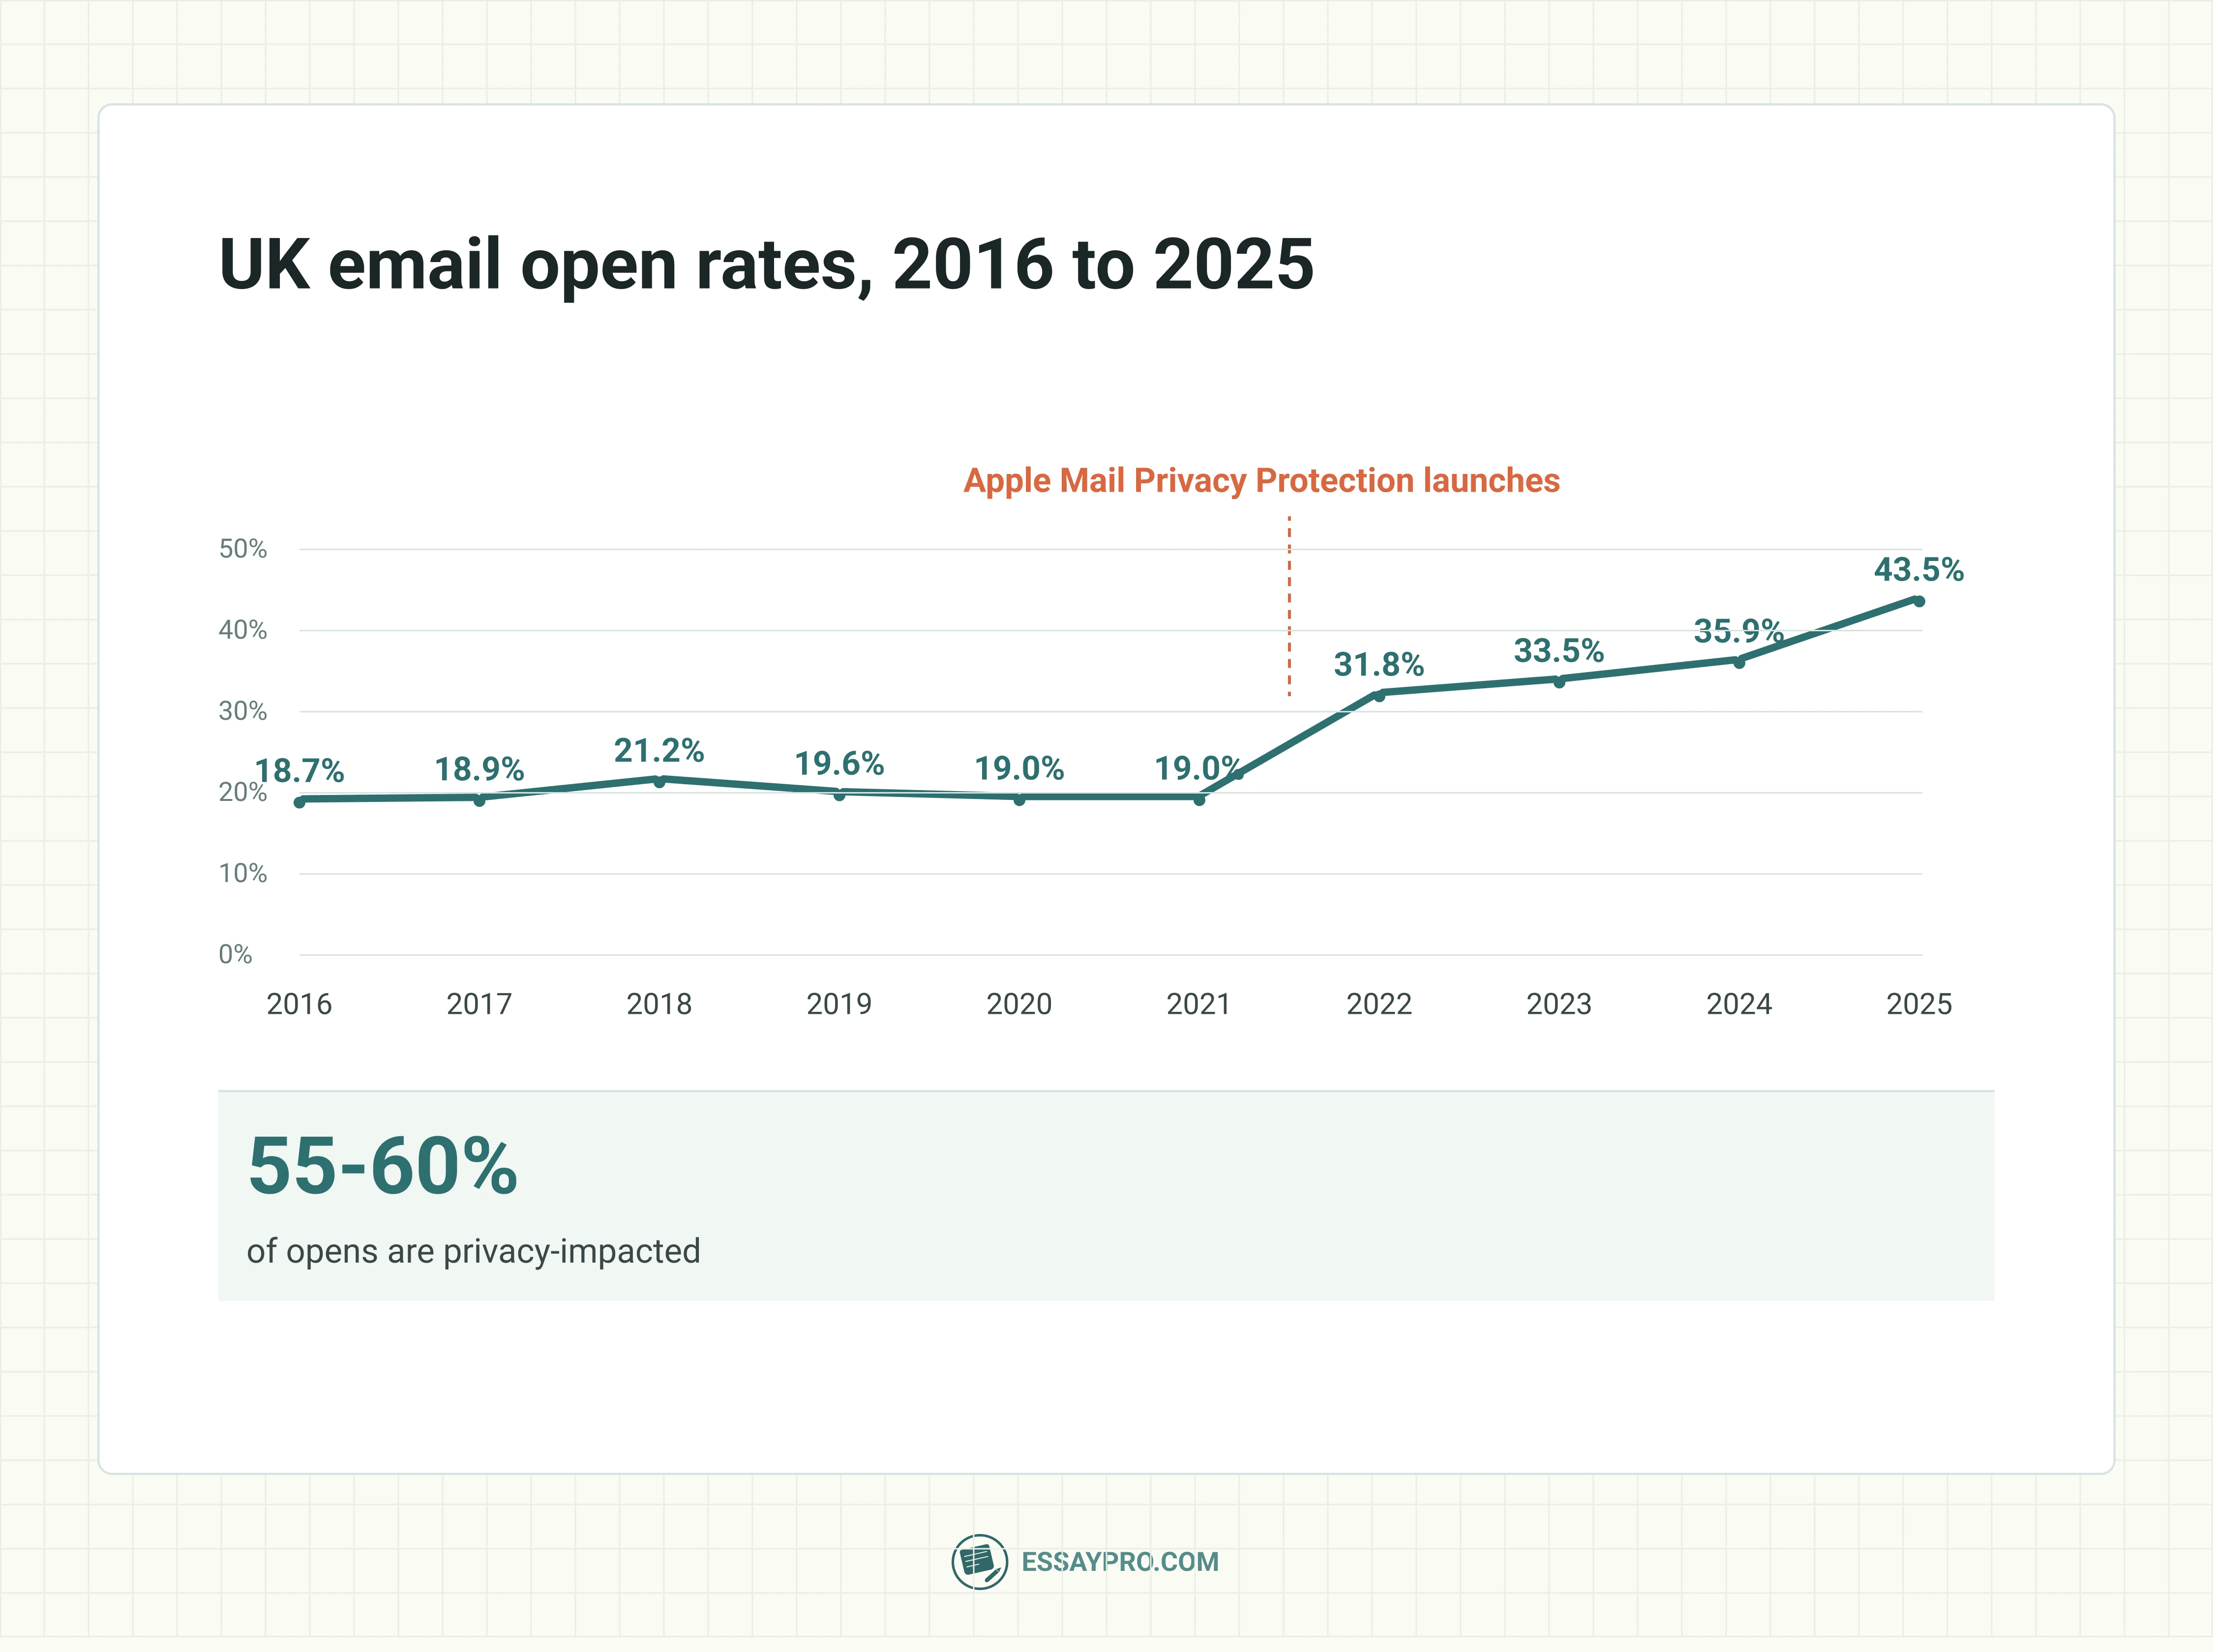
- UK open rates sat between 18.7% and 21.2% from 2016 to 2021. They then jumped to 31.8% in 2022 (DMA Email Benchmarking Report 2026, as summarized by SAP Engagement Cloud).
- The jump followed Apple’s privacy change. Mail Privacy Protection went live in September 2021, and Litmus says opens from users who turn it on aren’t reliable (Litmus).
- Open rates have kept climbing. UK opens were 33.5% in 2023, 35.9% in 2024, and 43.5% in 2025 (DMA, as summarized by SAP Engagement Cloud).
- The DMA calls 35.9% the new “year-zero” benchmark. It set that baseline after Apple’s change in 2022 (DMA Email Benchmarking Report, 2025).
- Clicks tell a steadier story. UK click rates were 1.5% in 2021 and reached a record 2.5% in 2025 (DMA, as summarized by SAP Engagement Cloud).
- 55-60% of opens are privacy-impacted. Litmus estimates this is the share of opens affected by Apple’s Mail Privacy Protection (Litmus).
- Bots have made open rates unreliable. Litmus says high-performing teams now track revenue per email, list churn, and lifetime value instead (Litmus, State of Email 2026).
- Only 11% of opens may be real. Zeta Global found unique opens of 40% against a “true open” rate of 11% once mailbox provider inflation was removed (Validity, on the DMA 2026 report).
- Gmail open rates dropped in Q1 2026. Many Validity customers saw big falls, which Validity attributes to changes in Gmail’s image fetching, while click rates held steady (Validity, on the DMA 2026 report).
- Ecommerce campaigns average a 31% open rate. The top 10% reach 45.1%, based on more than 183,000 brands (Klaviyo, 2026).
- Rates vary by industry. Campaign opens are 33.1% for clothing and accessories, 32.5% for home and garden, 29.3% for electronics, and 28.7% for mass merchants (Klaviyo, 2026).
- Automated emails open slightly more. Clothing and accessories reach 34.4% versus 33.1% for campaigns, and electronics 30.3% versus 29.3% (Klaviyo, 2026).
Email usage statistics
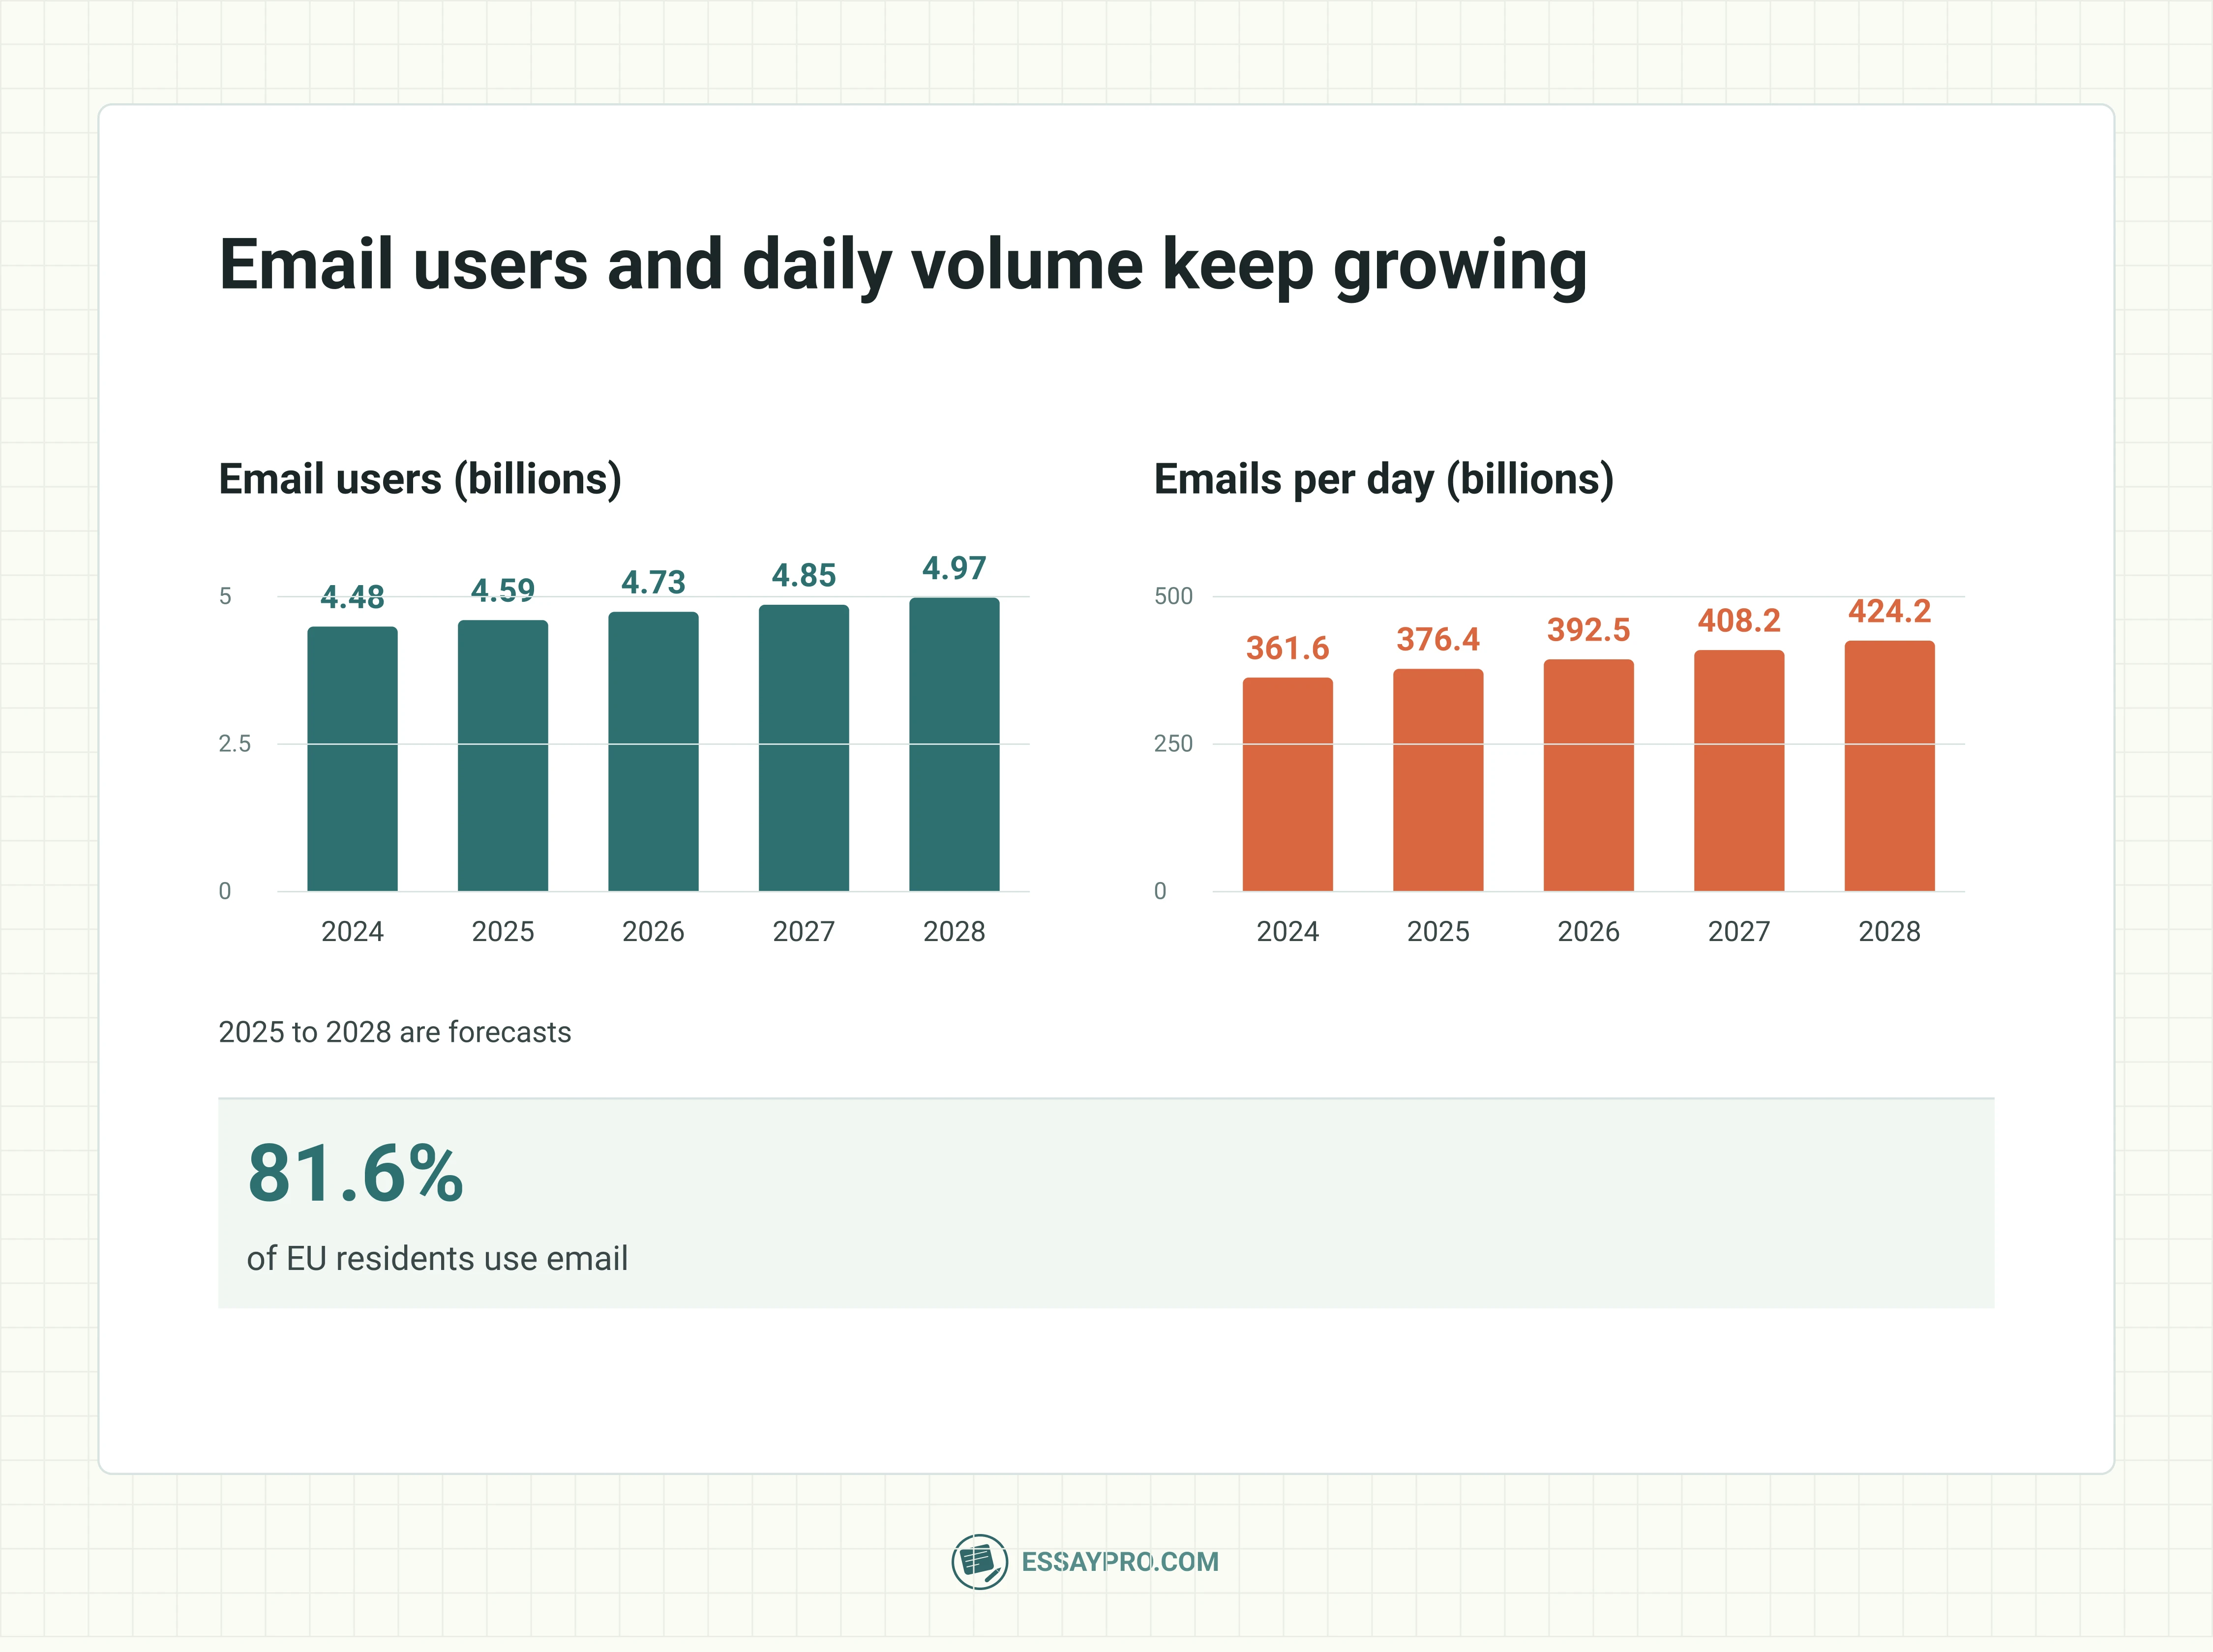
- 4.73 billion email users in 2026, heading for 4.97 billion in 2028. Radicati forecasts growth of about 3% a year, from 4.59 billion in 2025 (Radicati Group).
- 424.2 billion emails a day by 2028. Radicati forecasts 408.2 billion in 2027, up from 392.5 billion in 2026 (Radicati Group).
- 81.6% of EU residents used email in 2025. This is the share of all people aged 16 to 74 who sent or received email online, up from 80% in 2024 (Eurostat).
- Usage varies widely across Europe. The Netherlands (97.69%), Denmark (96.84%), and Ireland (95.20%) lead the EU, while Romania (45.95%) and Bulgaria (51.78%) are lowest (Eurostat).
- City residents use email more than rural ones. In 2023, the share was 83% in EU cities and 72% in rural areas (Eurostat).
- Workers are interrupted every two minutes. Meetings, emails, and chats interrupt the average Microsoft 365 worker about 275 times a day (Microsoft Work Trend Index, 2025).
- 44.99% of global email traffic was spam in 2025. That is 2.28 percentage points lower than in 2024 (Kaspersky, Securelist).
- 144 million malicious attachments in 2025. Kaspersky says detections rose 15% on the year (Kaspersky).
Email engagement statistics
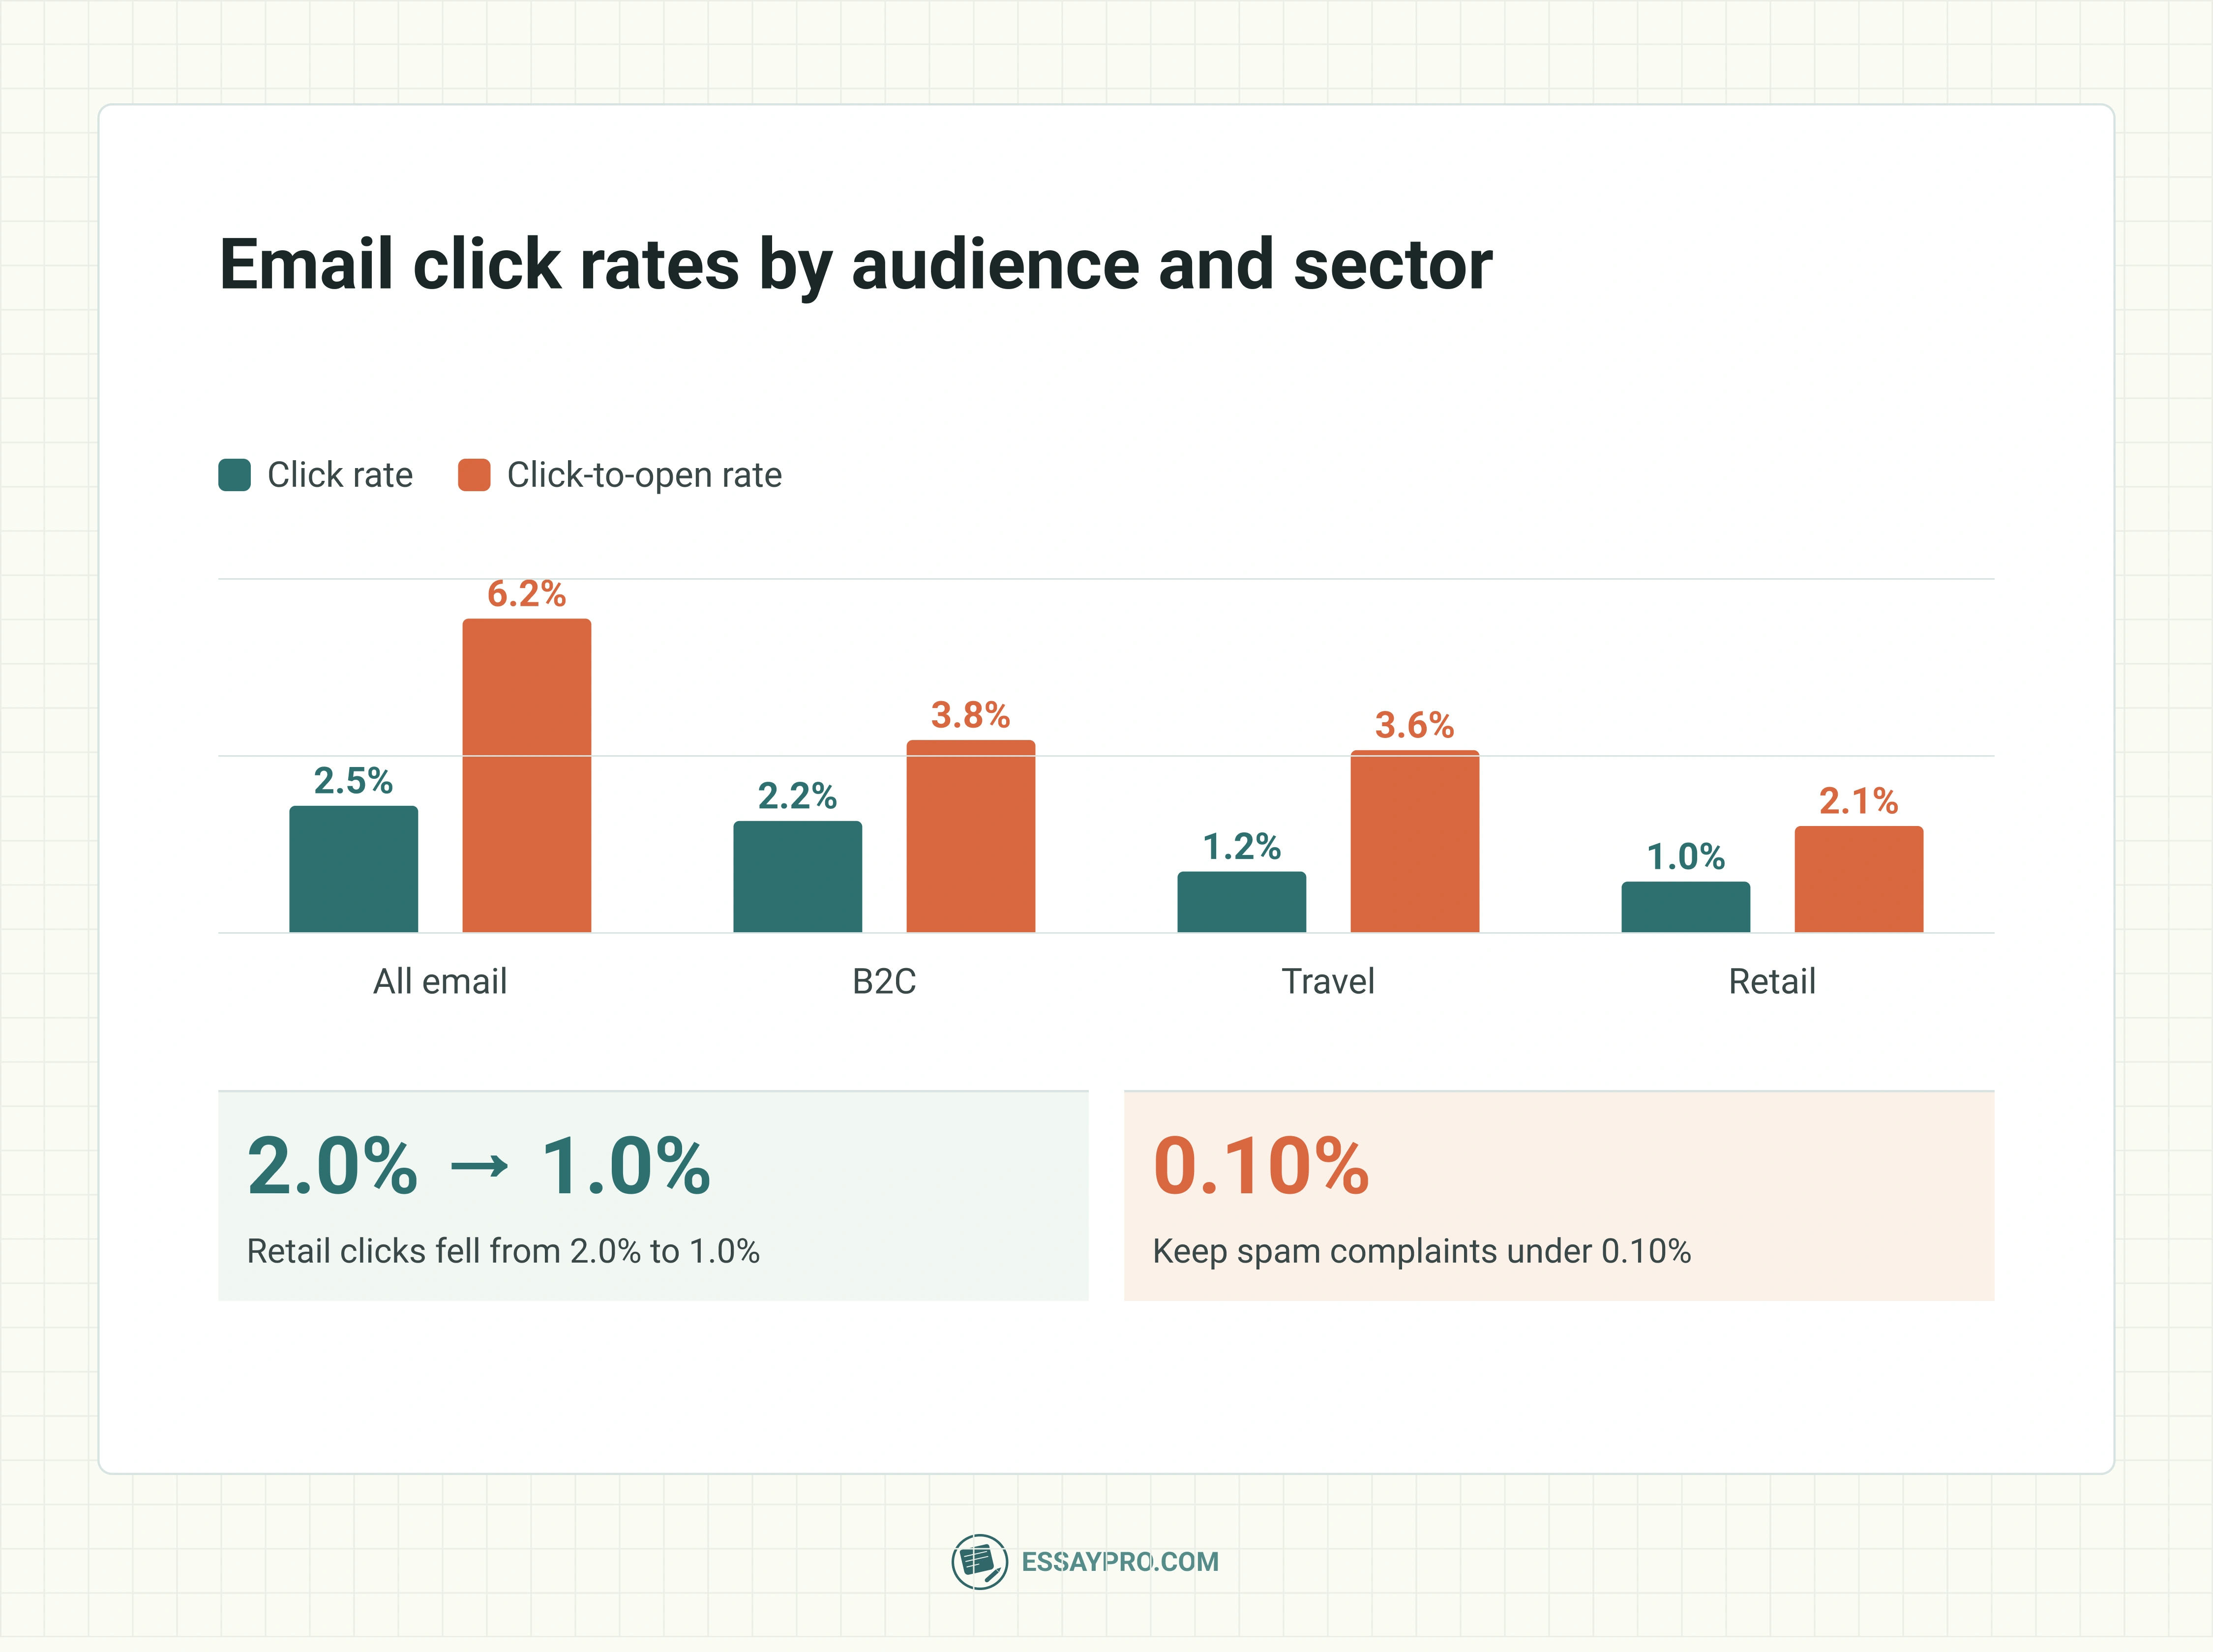
- 2.5% unique click rate, a record. In 2025, UK clicks reached this high across all email, with B2C at 2.2% and travel at 1.2% (DMA Email Benchmarking Report 2026, as summarized by SAP Engagement Cloud).
- 6.2% click-to-open rate. B2C was 3.8%, travel 3.6%, and retail 2.1% (DMA, as summarized by SAP Engagement Cloud).
- Retail clicks halved. Retail’s click rate fell from 2.0% to 1.0%, even though its open rate was 49.2% (DMA, as summarized by SAP Engagement Cloud).
- 0.10% unsubscribe rate in 2025. That is down from a spike of 0.38% in 2024 (DMA, as summarized by SAP Engagement Cloud).
- Bounces stay low. UK hard bounces averaged 0.04%, and soft bounces rose to 0.022% from 0.017% as Google and Yahoo enforced sender rules (DMA, as summarized by SAP Engagement Cloud).
- Spam complaints must stay under 0.10%. Google tells senders to avoid ever reaching 0.30% (Gmail Help, email sender guidelines).
- Fewer marketers judge success by opens. Opens as a primary objective metric fell from 31% to 23%, even though 63% say their open rates are trending up (DMA Marketer Email Tracker, 2026).
- 65% of marketers think most of their emails are relevant. That is up from 59% in 2021 (DMA Marketer Email Tracker, 2026).
- Triggered messages are gaining ground. 26% of marketers now cite them as a driver of email effectiveness, up from 16% in 2021 (DMA Marketer Email Tracker, 2026).
- Discounts lead the content marketers rely on. 58% name discounts and offers, ahead of reviews and guides (48%), confirmations (42%), and advice or tutorials (41%) (DMA Marketer Email Tracker, 2026).
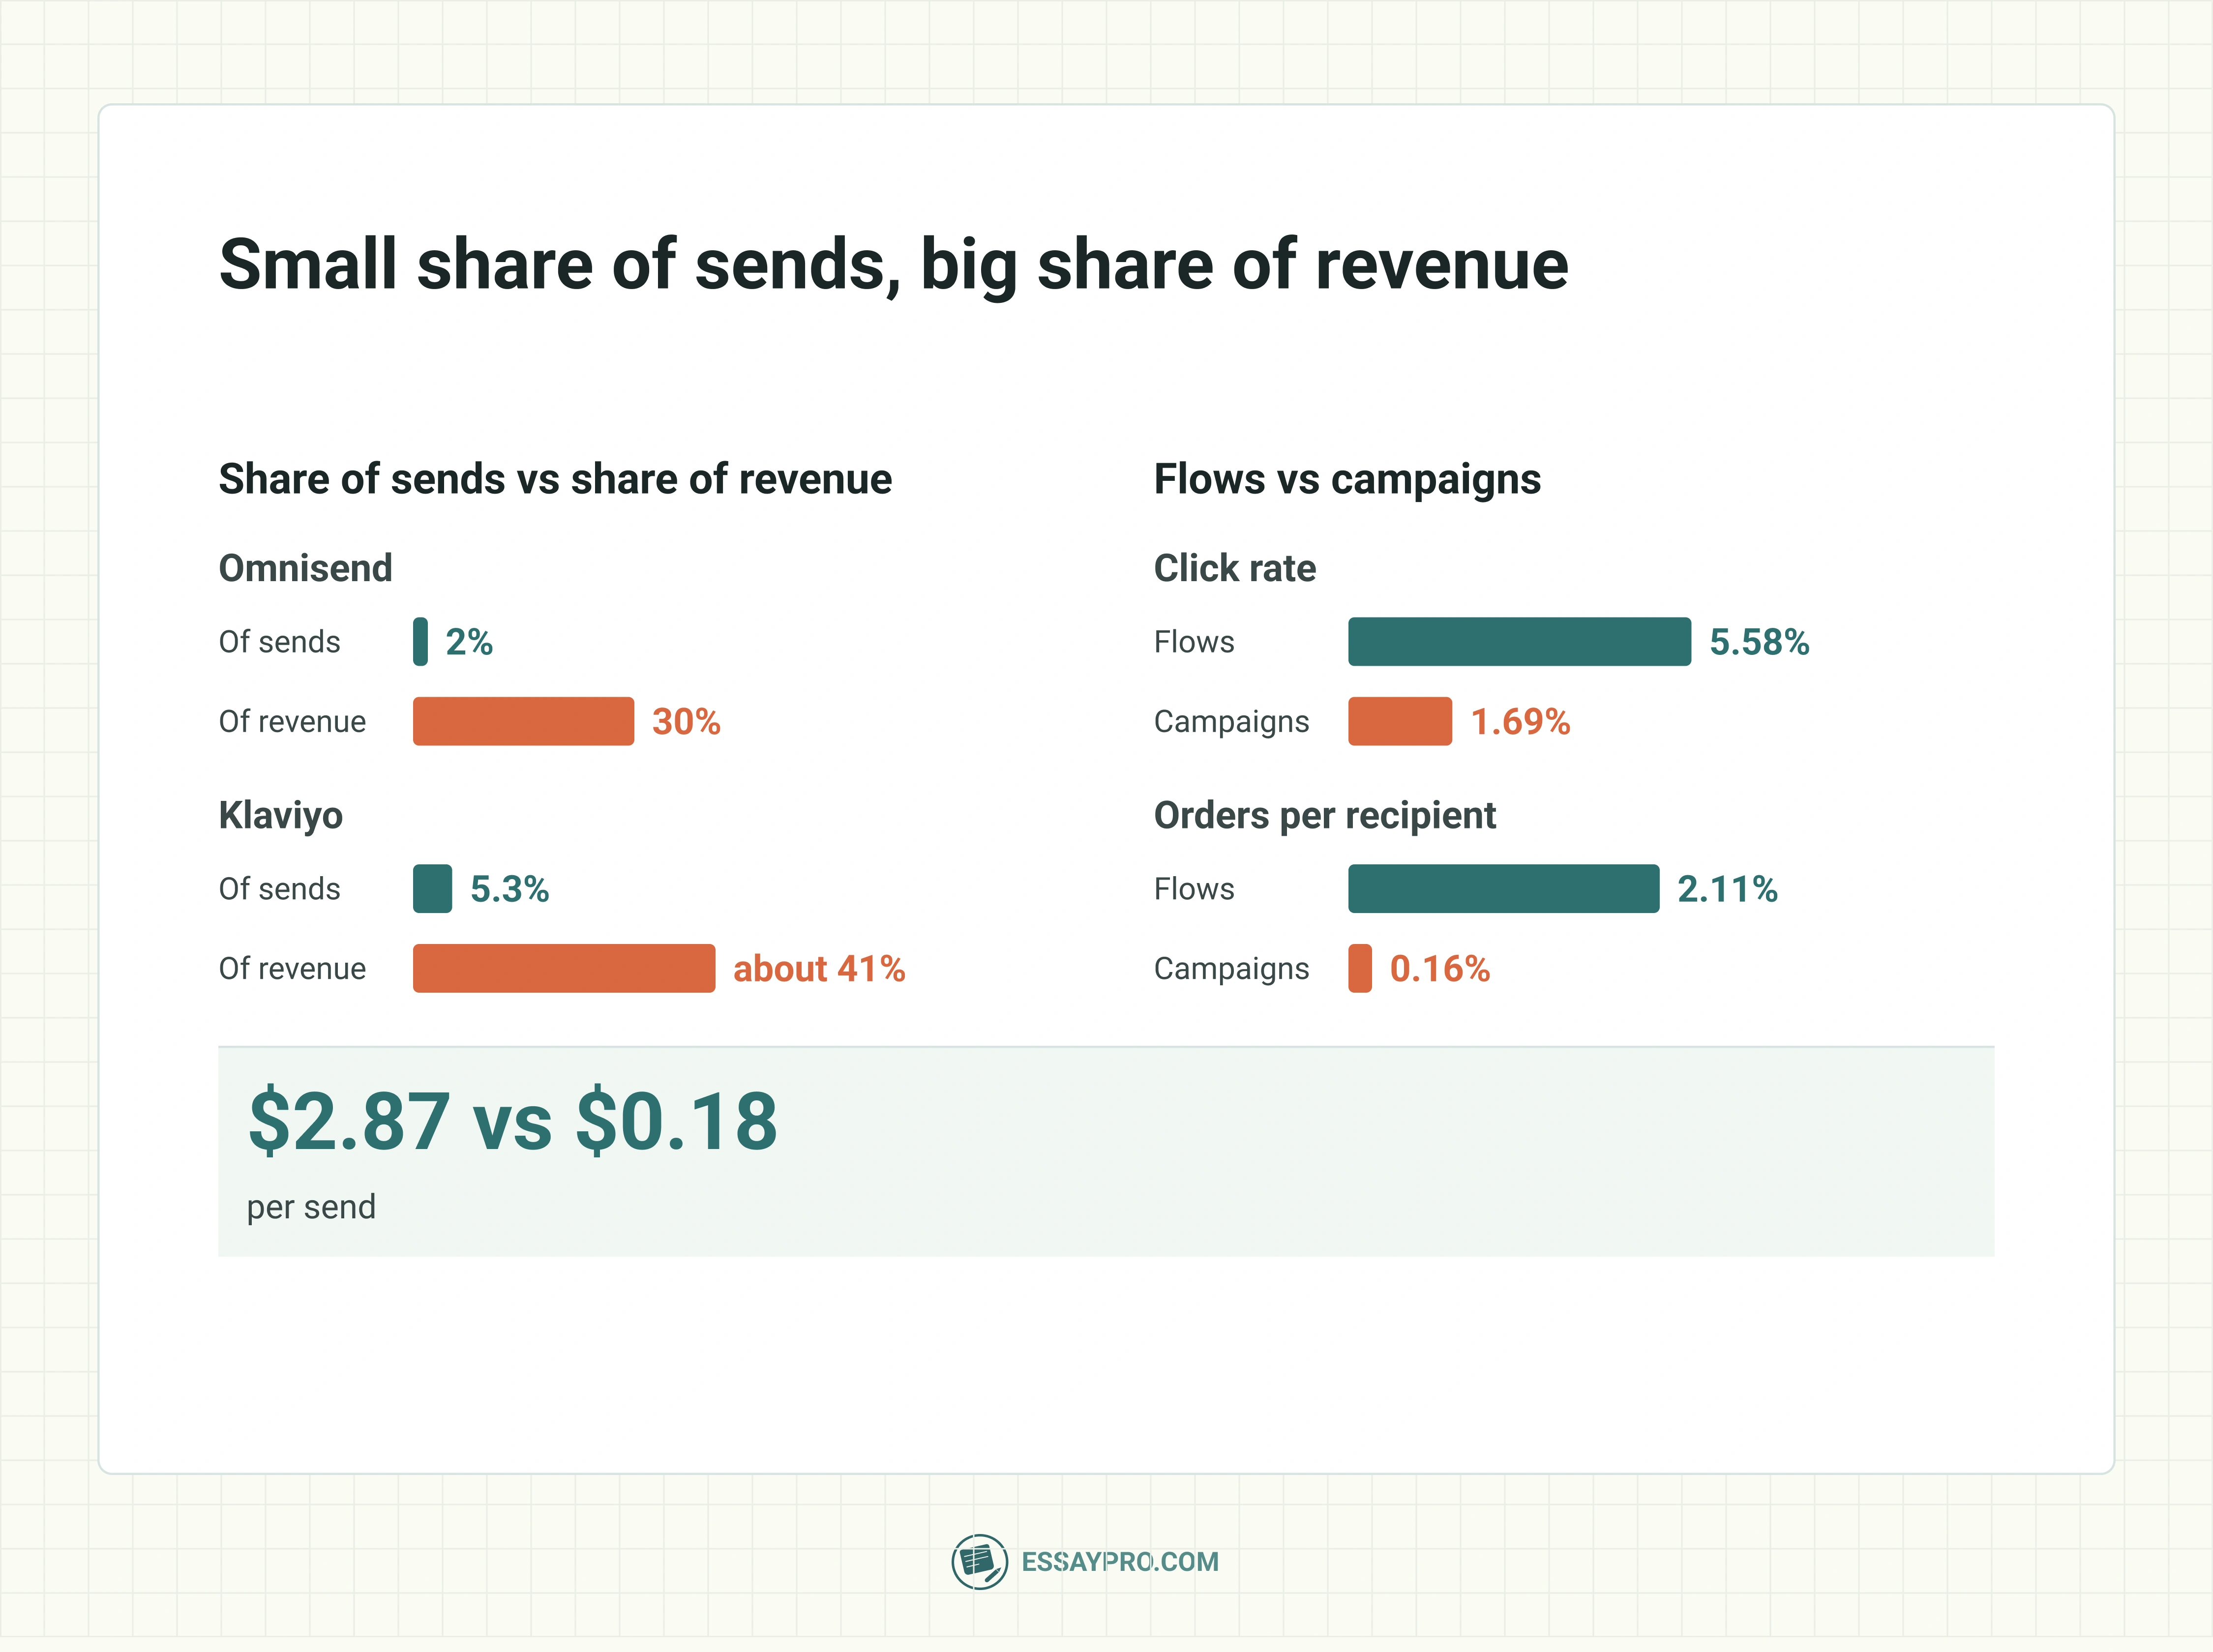
- Automated emails get far more clicks. Flows average a 5.58% click rate (10.48% for the top 10%), versus 1.69% for campaigns (3.38% for the top 10%) (Klaviyo, 2026).
- Campaign clicks range from 1.24% to 2.03% by industry. Toys and hobbies is highest and health and beauty lowest (Klaviyo, 2026).
- Newsletter readers favor briefings. Seven in ten at least sometimes read news briefings or summaries, and six in ten read deep dives (Pew Research Center, 2026).
- 34% of marketers ask unsubscribers why they leave. That is up 23 points since 2021 (DMA Marketer Email Tracker, 2026).
Visual email marketing statistics
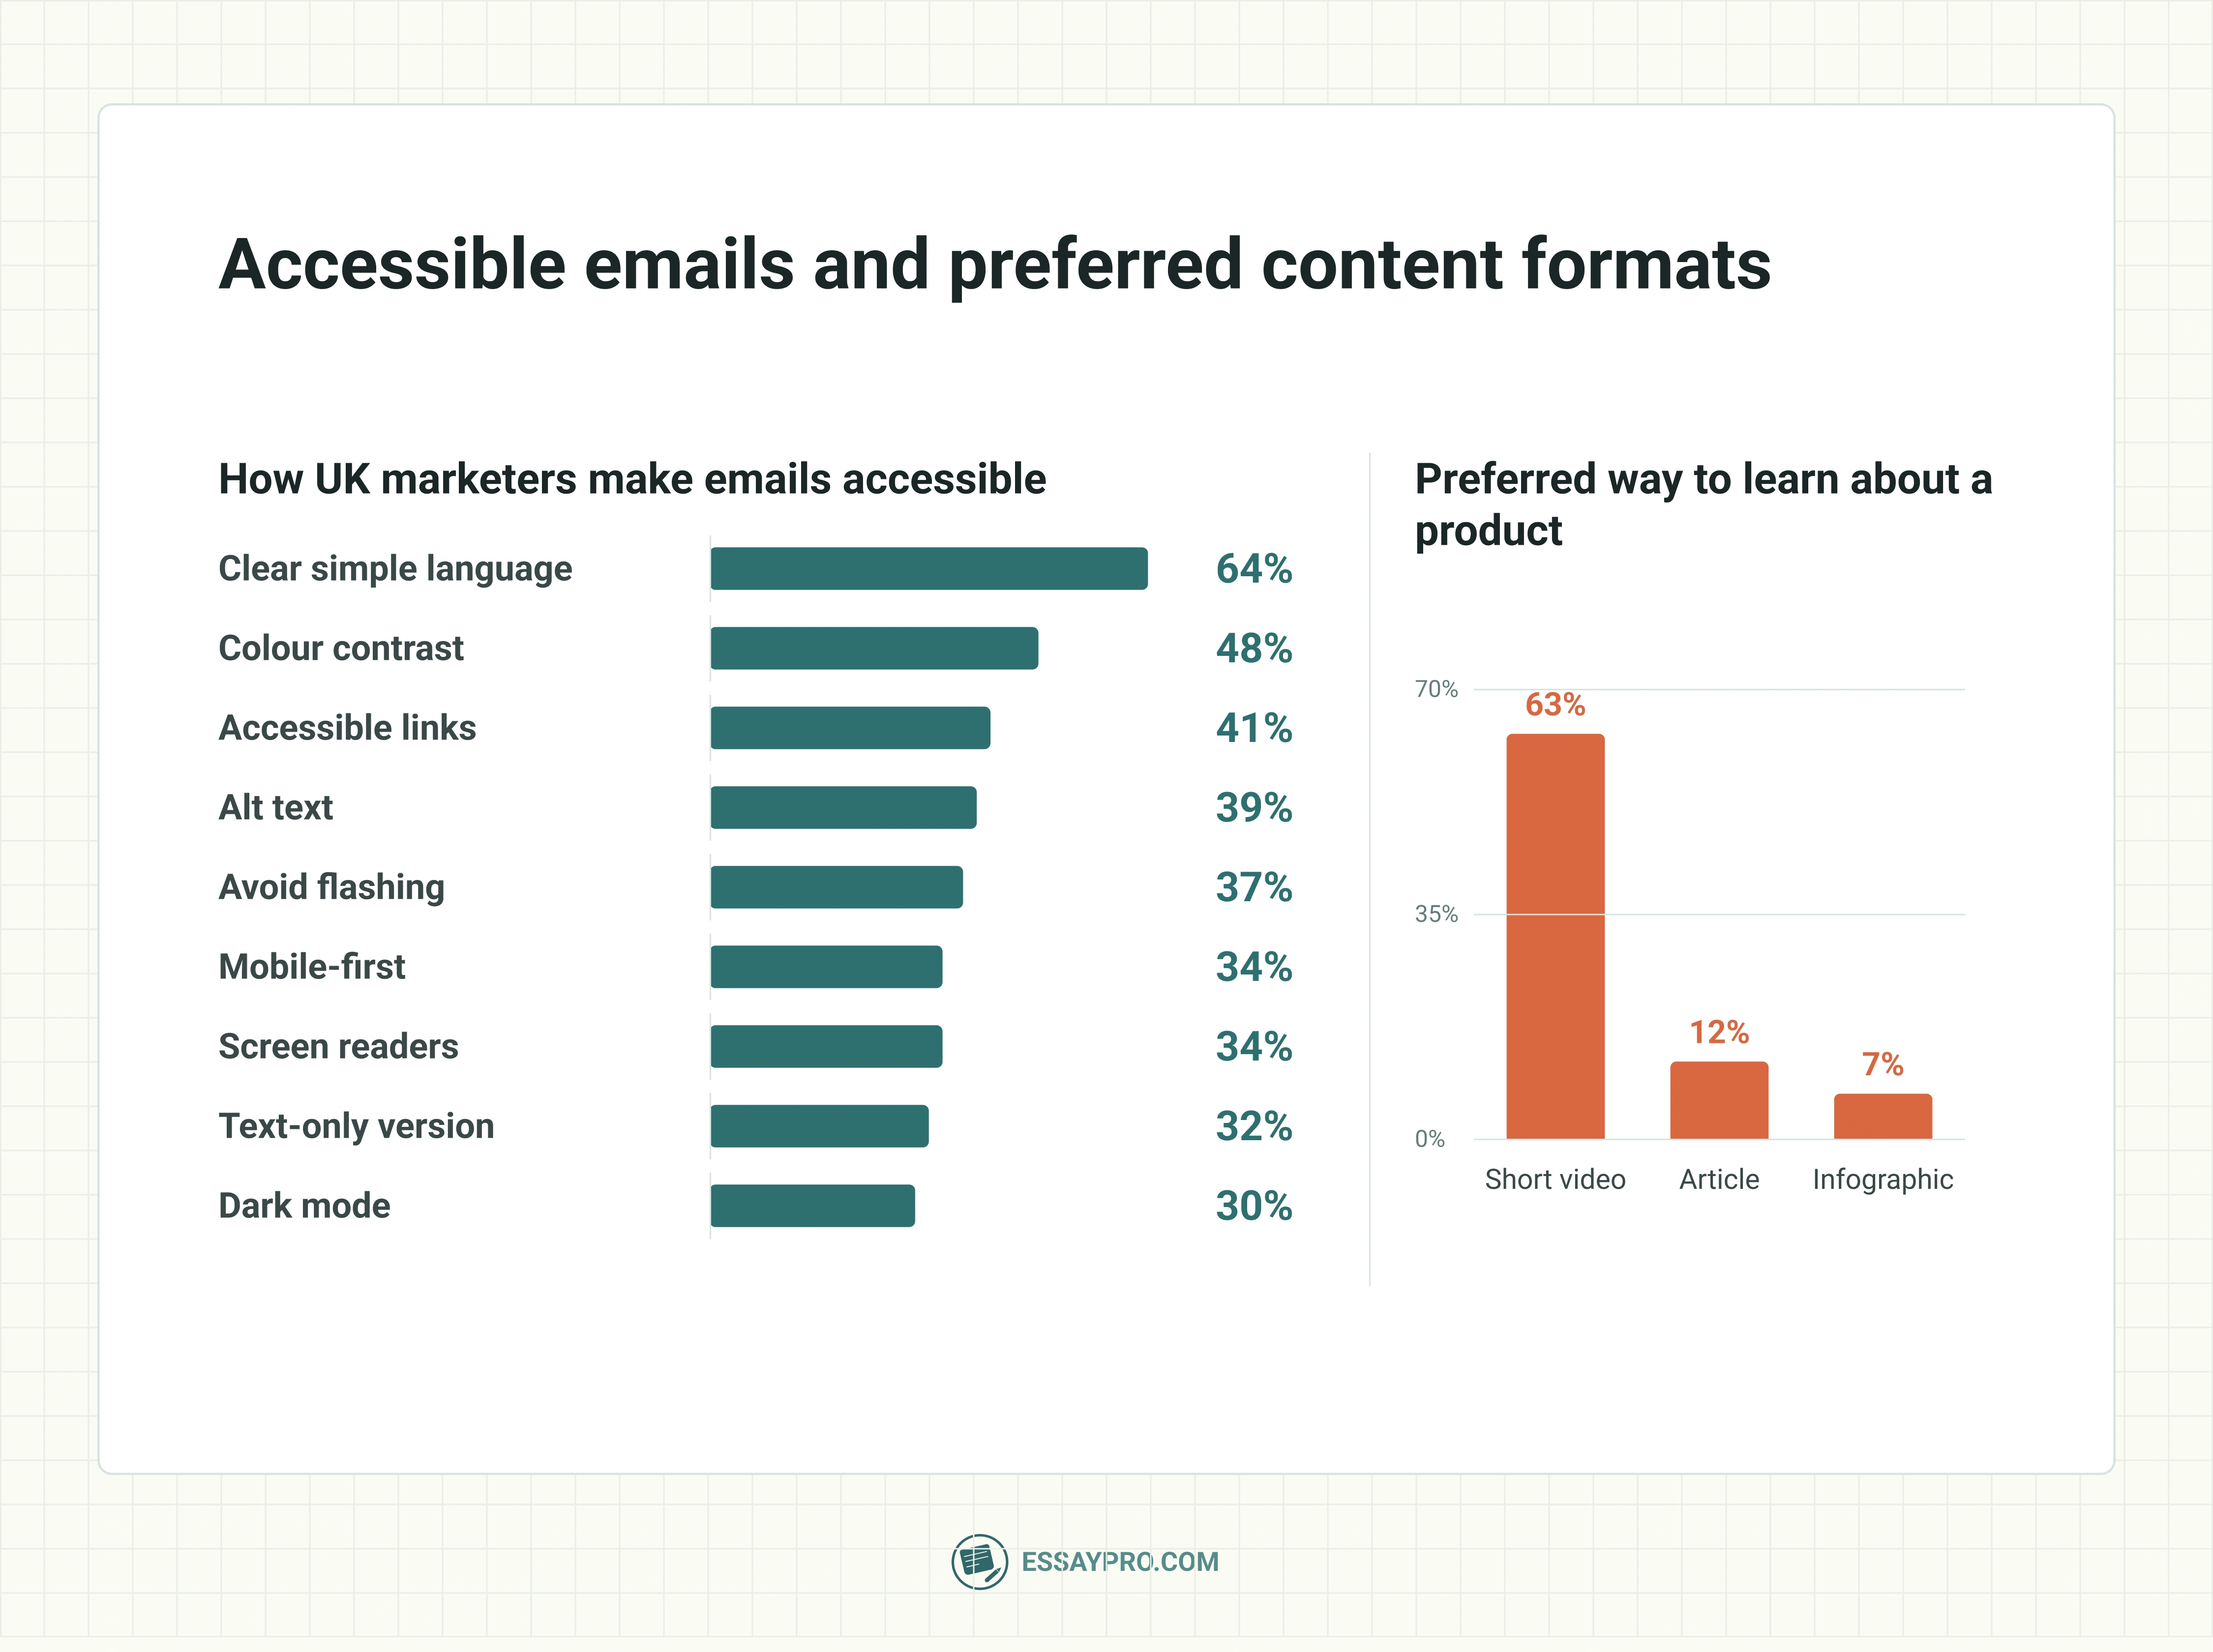
- 39% of marketers use alt text. Two-thirds send emails that screen readers struggle to interpret (DMA Marketer Email Tracker, 2026).
- 30% make sure emails work in dark mode. Litmus says over a quarter of its users read in dark mode (DMA Marketer Email Tracker, 2026; Litmus).
- 48% check colour contrast and readable fonts. 37% avoid flashing or animated content, and 34% design mobile-first (DMA Marketer Email Tracker, 2026).
- 34% optimize for screen readers. 32% provide text-only versions of their emails (DMA Marketer Email Tracker, 2026).
- 91% of businesses use video marketing. 93% of video marketers call it important to their strategy (Wyzowl, State of Video Marketing 2026).
- 63% of consumers prefer a short video to learn about a product. Reading an article (12%) and viewing an infographic (7%) trail far behind (Wyzowl, 2026).
- 71% of marketers say 30 seconds to 2 minutes works best. The largest group, 51%, picks 30 to 60 seconds (Wyzowl, 2026).
- 89% of consumers say video quality affects their trust in a brand. 85% have been convinced to buy by a video (Wyzowl, 2026).
- Interactive video is less proven. 31% of video marketers use it, but only 20% rate it effective (Wyzowl, 2026).
- 63% of video marketers have used AI to create or edit video. That is up from 51% a year earlier (Wyzowl, 2026).
Targeted/personalized email marketing statistics
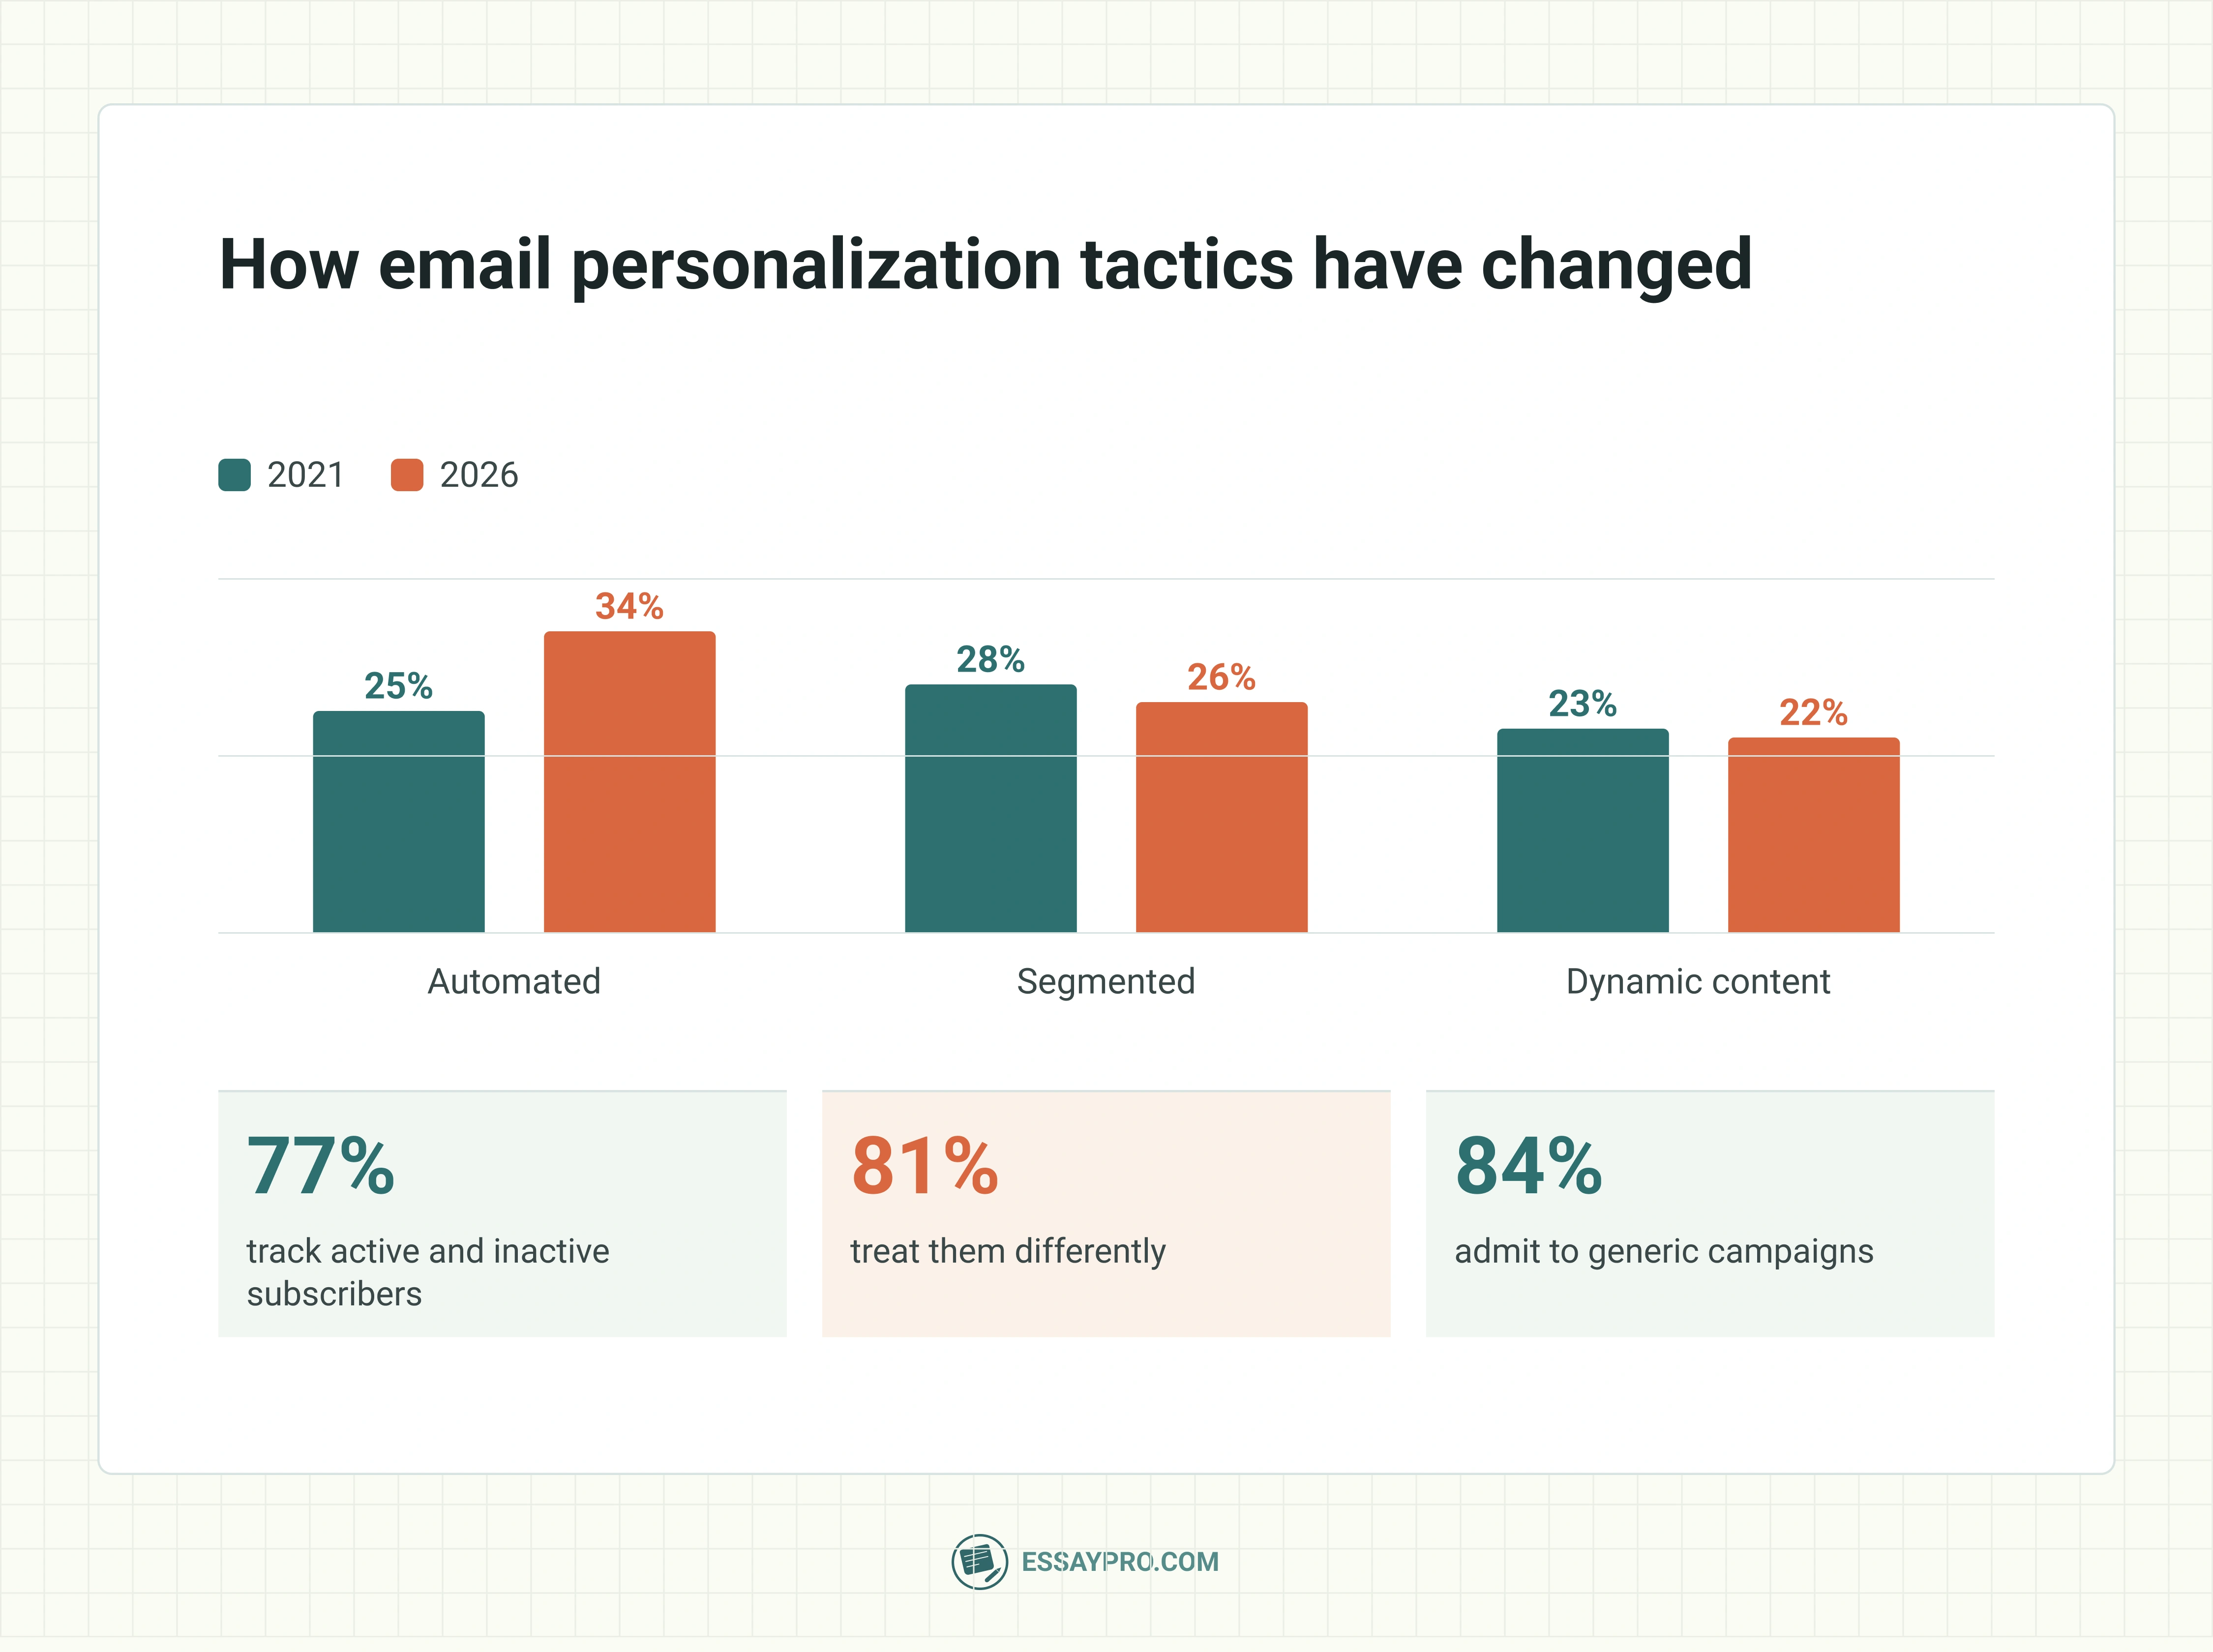
- 77% of marketers track active and inactive subscribers. That is up from 66% in 2021, and 81% treat the two groups differently, up from 73% (DMA Marketer Email Tracker, 2026).
- Segmented emails slipped to 26% of sends. They were 28% in 2021, dynamic content fell from 23% to 22%, and bulk sends still make up 33% (DMA Marketer Email Tracker, 2026).
- Automated emails are 34% of sends. That is up 9 points since 2021, and AI-driven emails are a new category at 19% (DMA Marketer Email Tracker, 2026).
- Interests are the most valued customer data. 43% of marketers rank them first, ahead of name (38%) and postcode (32%) (DMA Marketer Email Tracker, 2026).
- 62% of marketers claim good or advanced AI skills. Only 34% to 50% use AI for key tasks (DMA Marketer Email Tracker, 2026).
- 64% fear personalization will suffer if tracking is restricted. 66% plan to increase tracking, while 76% say the industry should tell recipients about it (DMA Marketer Email Tracker, 2026).
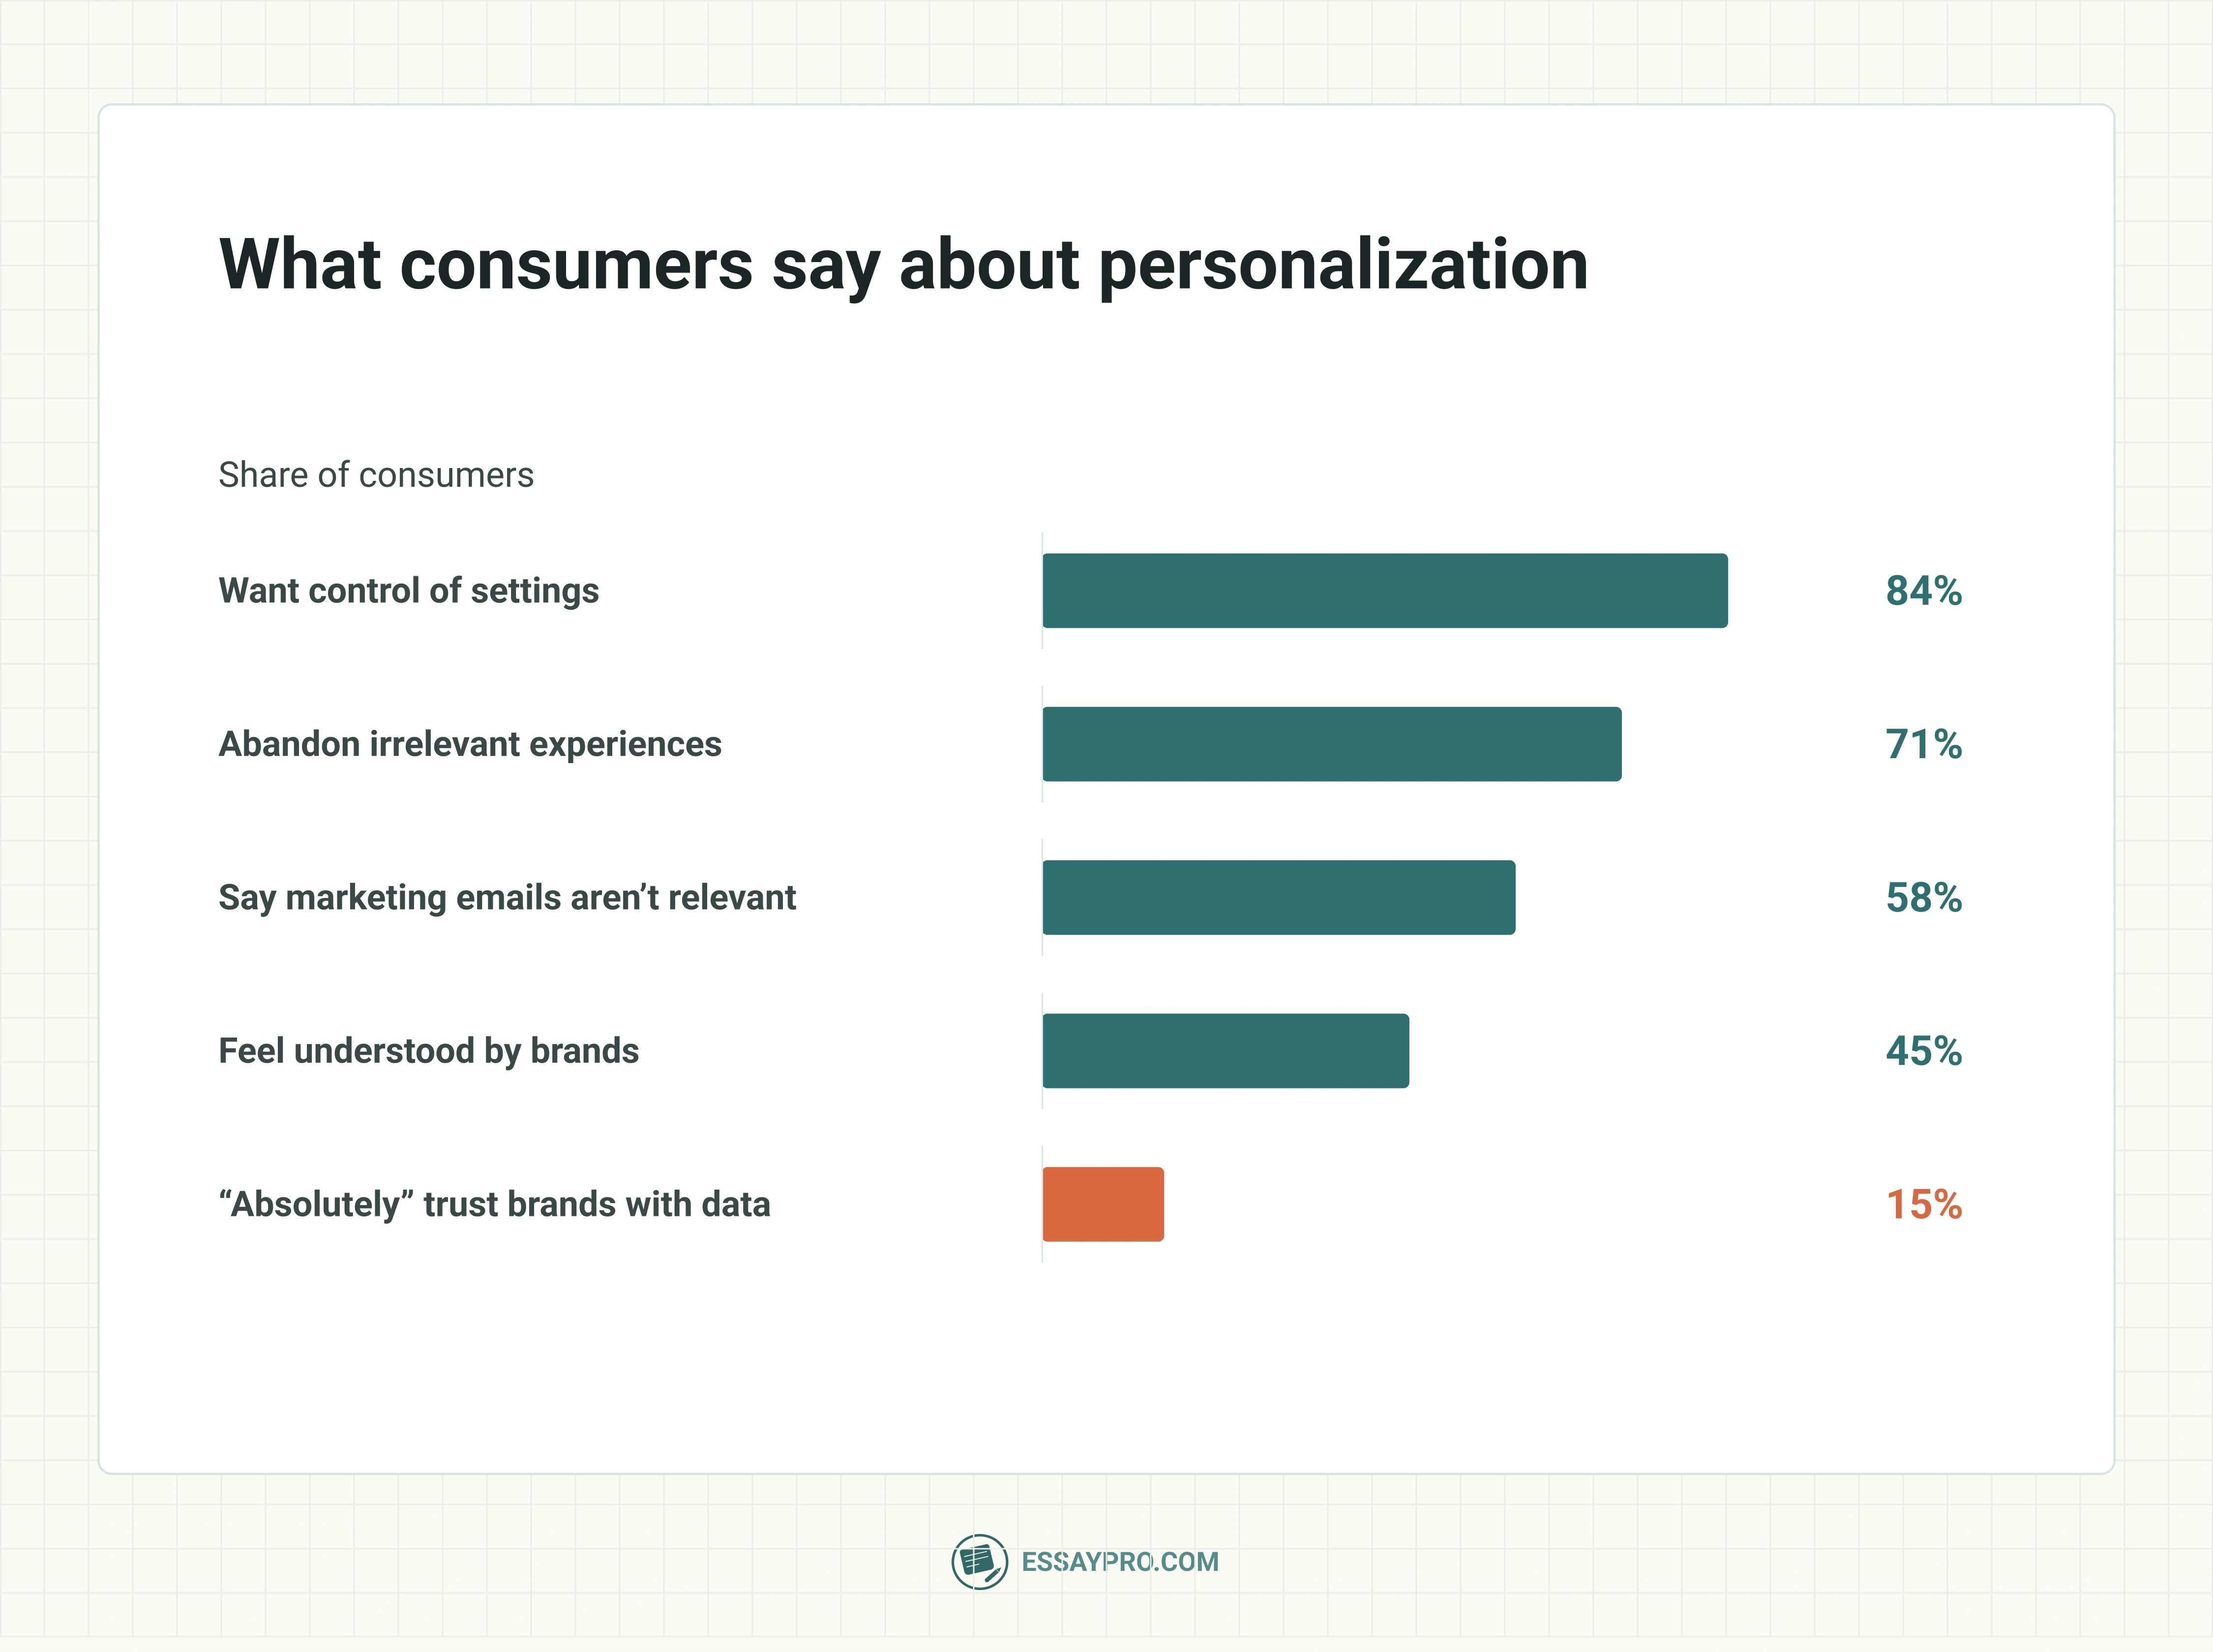
- 58% of consumers say most marketing emails aren’t relevant. This comes from SAP’s Global Engagement Index 2026 (SAP Engagement Cloud).
- Only 45% of consumers feel understood by brands. Yet 75% of companies report higher customer spend from personalization (Twilio State of Customer Engagement, 2025).
- 84% of consumers want control over their personalization settings. Only 15% “absolutely” trust brands with their data (Twilio, 2025).
- 71% of consumers abandon irrelevant experiences. 61% don’t believe brands use their data in the consumer’s best interest (Twilio, 2025).
- Triggered flows earn nearly 41% of email revenue from 5.3% of sends. They also deliver 13 times the placed order rate of campaigns (Klaviyo, 2026).
Email segmentation statistics
- Only 26% of UK emails are segmented. That is down from 28% in 2021, while 33% of emails are still bulk sends (DMA Marketer Email Tracker, 2026).
- 77% of marketers track active and inactive subscribers. That is up from 66% in 2021, and 81% treat the two groups differently, up from 73% (DMA Marketer Email Tracker, 2026).
- Interests are the most valued data for segmenting. 43% of marketers rank them first, ahead of name (38%) and postcode (32%) (DMA Marketer Email Tracker, 2026).
- 73% have rules on how often they email each person. That is down from 75% in 2021 (DMA Marketer Email Tracker, 2026).
- 84% of marketers admit to running generic campaigns. The finding comes from a survey of nearly 4,500 marketers (Salesforce State of Marketing, 10th edition).
- 41% of marketers with AI segment by predicted behavior. Among marketers without AI, the share is 30% (Salesforce State of Marketing, 10th edition).
- 46% lack data on customer preferences or struggle to make content relevant. 98% of marketers with AI hit at least one barrier to personalization, with data problems the most common (Salesforce State of Marketing, 10th edition).
- 78% say they need more personalized content than they can produce. This is the gap between wanting segmentation and delivering it (Salesforce State of Marketing, 10th edition).
Email marketing automation statistics
- Automated emails are 34% of UK sends. That is up 9 points since 2021, and AI-driven emails are a new category at 19% (DMA Marketer Email Tracker, 2026).
- 62% claim good or advanced AI skills, but only 34% to 50% use AI for key tasks. Of those who do, just 30% to 44% report real improvement (DMA Marketer Email Tracker, 2026).
- Only 30% use their email tech stack very effectively. The share is 41% for large businesses and 22% for small and mid-sized ones (DMA Marketer Email Tracker, 2026).
- Automated emails are 2% of sends but 30% of email revenue. They earned $2.87 per send versus $0.18 for scheduled campaigns, from 27 billion emails sent by 150,000 brands in 2025 (Omnisend, 2026).
- 31.2% of clicks on automated emails led to a purchase. Omnisend says that is about one in three clicks (Omnisend, 2026).
- Welcome and abandoned cart emails drove 76% of automated orders. They are the workhorses of ecommerce automation (Omnisend).
- Birthday automations averaged a $744.37 order. That is more than four times the platform average (Omnisend, 2026 report).
- Flows earn nearly 41% of email revenue from 5.3% of sends. They deliver 3 times the click rate and 13 times the placed order rate of campaigns (Klaviyo, 2026).
- Flows convert 2.11% of recipients into orders, versus 0.16% for campaigns. The top 10% of flows reach 4.3% (Klaviyo, 2026).
- Only 13% of marketers use agentic AI. High performers are nearly twice as likely as underperformers to use AI agents (Salesforce State of Marketing, 10th edition).
- Marketers report gains from deploying AI. They cite +20% marketing ROI, +19% conversion rates, and 19% lower marketing costs, all self-reported (Salesforce State of Marketing, 10th edition).
- AI agents could free up eight hours a week. That is what marketers expect to reclaim from automating busy work (Salesforce, 2026).
Email marketing statistics by industry
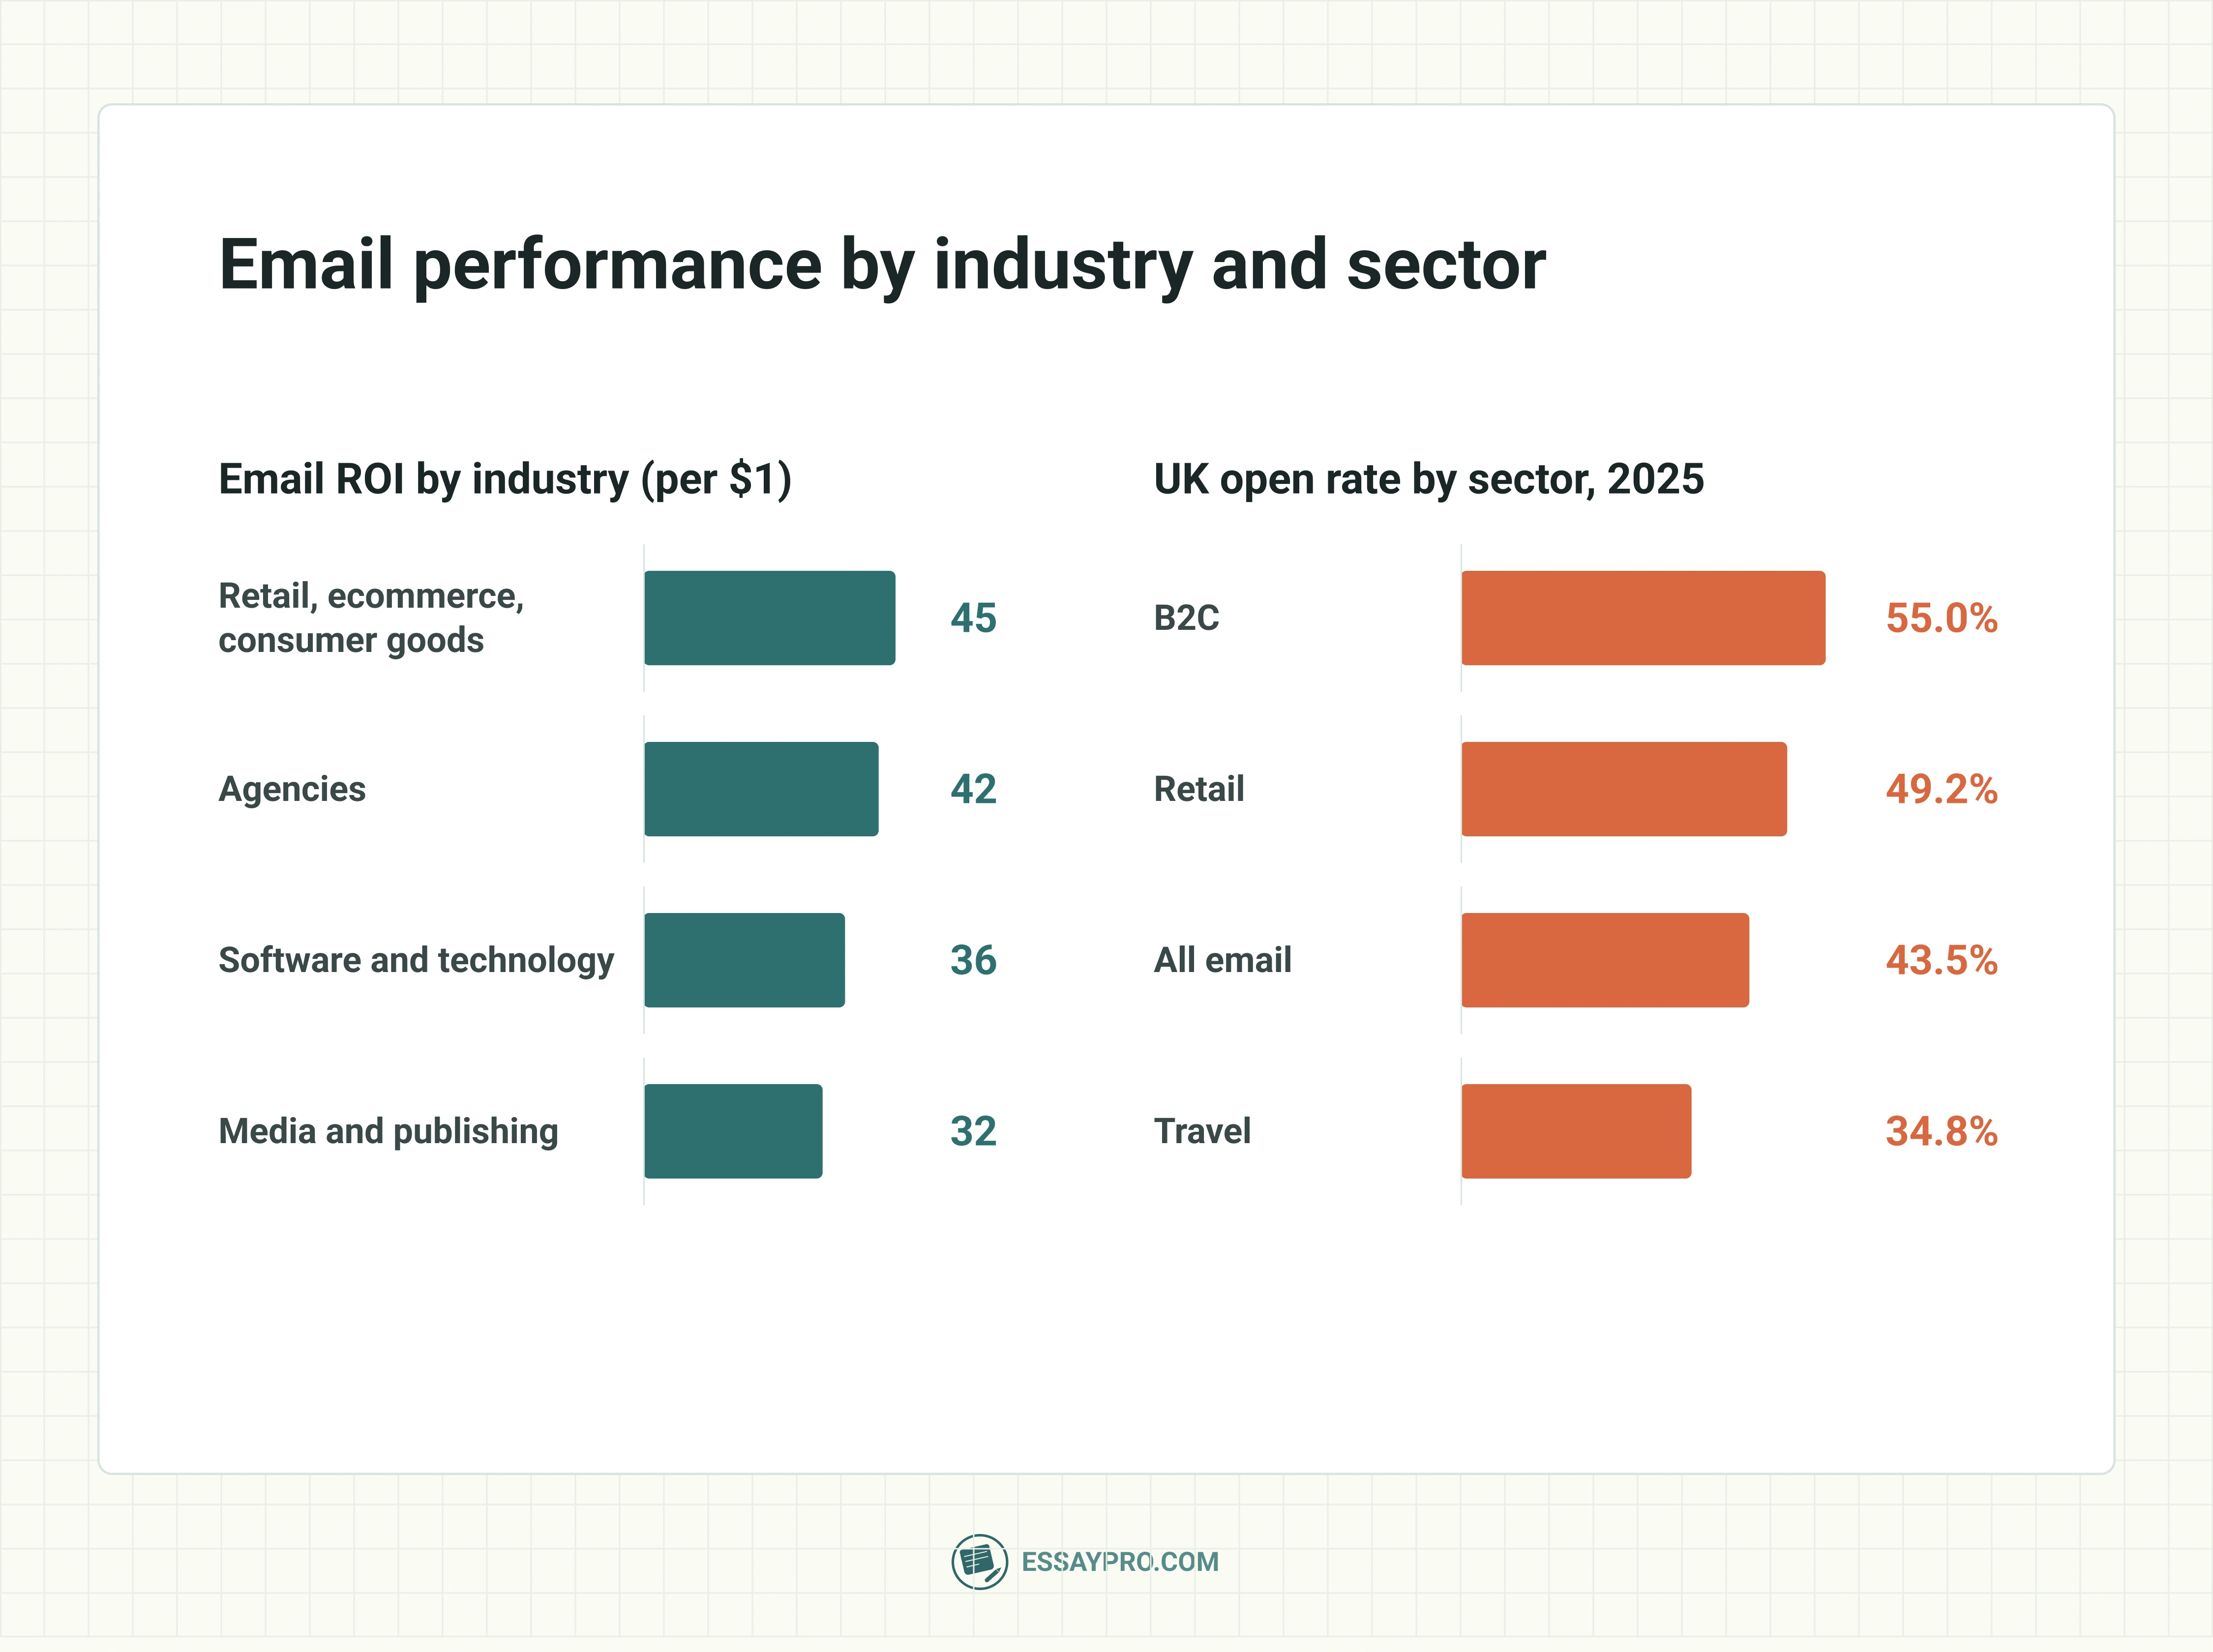
- Retail, ecommerce, and consumer goods lead on ROI at 45:1. Agencies follow at 42:1, software and technology at 36:1, and media, publishing, events, sports, and entertainment at 32:1 (a 2020 survey of more than 2,000 marketers) (Litmus).
- B2C email opens at 55.0% in the UK. Its click rate is 2.2% and its click-to-open rate 3.8%, against 43.5%, 2.5%, and 6.2% for all email (DMA Email Benchmarking Report 2026, as summarized by SAP Engagement Cloud).
- Retail opens at 49.2% but clicks at only 1.0%. Its click-to-open rate is 2.1%, and delivery reached 99.2% (DMA, as summarized by SAP Engagement Cloud).
- Travel opens at 34.8%. Its click rate is 1.2% and its click-to-open rate 3.6% (DMA, as summarized by SAP Engagement Cloud).
- B2B delivery is lower than B2C. It reached 95.6%, up from 90.7%, against 99.2% across all email (Validity, on the DMA 2026 report).
- Clothing and accessories lead ecommerce campaign opens at 33.1%. Mass merchants trail at 28.7% (Klaviyo, 2026).
- Toys and hobbies lead campaign clicks at 2.03%. Health and beauty trail at 1.24% (Klaviyo, 2026).
- Food and beverage lead on orders. Campaigns convert 0.26% to orders and flows 2.46%, against 0.08% and 1.85% for jewellery (Klaviyo, 2026).
- Ecommerce opens rose to 30.7% in 2025. Top-performing brands drove 57% of the year’s order growth (Omnisend, 2026 report).
- Government emails get the most engagement of any industry. Opens average 40.55% and clicks 4.58%, while vitamin supplements are lowest at 27.34% and 1.19% (data updated December 2023) (Mailchimp).
- Nonprofits and education also beat the average. Nonprofits get 40.04% opens and 3.27% clicks, and education and training 35.64% and 3.02%, against 29.81% and 1.74% for ecommerce (data updated December 2023) (Mailchimp).
- Newsletter sources are evenly split. 25% of US newsletter readers say most of their newsletters come from a news organization, 24% from independent writers, and 22% from an even mix (Pew Research Center, 2026).
Email marketing statistics by age
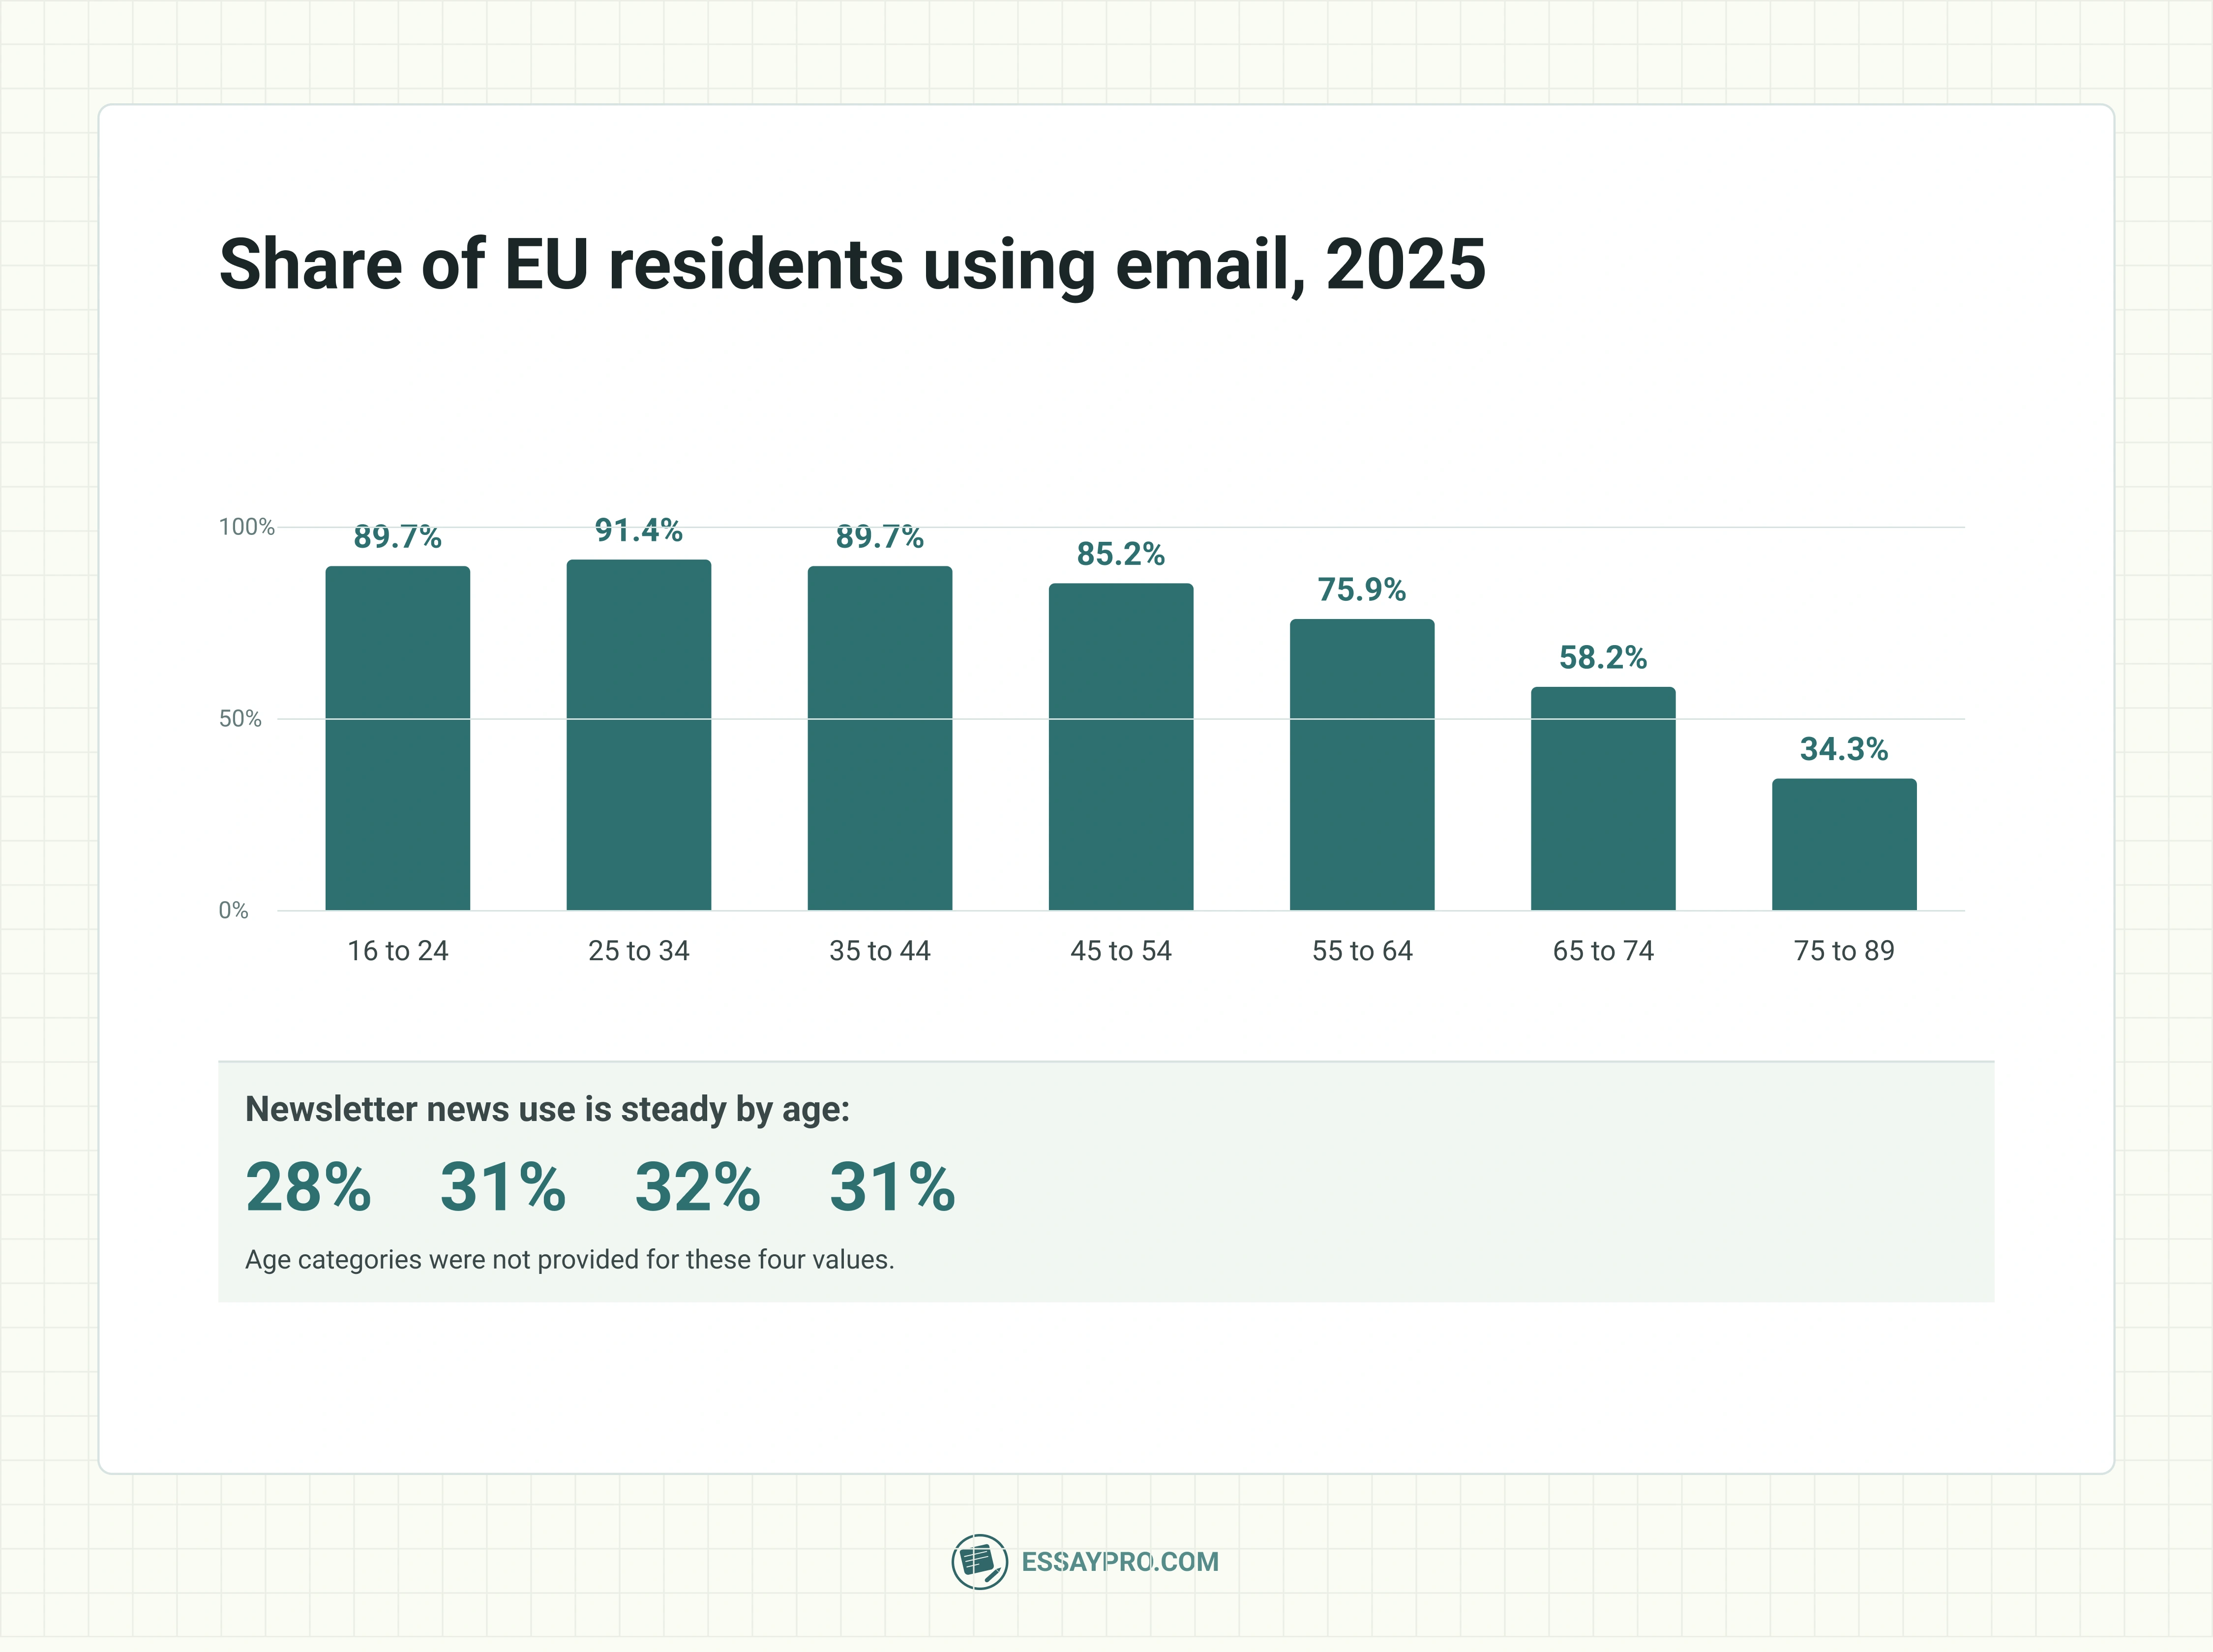
- Email use peaks at 92.2% among 20- to 24-year-olds. This is the share of EU residents who sent or received email online in 2025, against 81.6% of all people aged 16 to 74 (Eurostat).
- Use stays high through middle age. It is 91.4% for ages 25 to 34, 89.7% for 35 to 44, and 85.2% for 45 to 54 (Eurostat).
- Use drops sharply after 55. It is 75.9% for ages 55 to 64, 58.2% for 65 to 74, and 34.3% for 75 to 89 (Eurostat).
- 98% of young EU adults use the internet daily. The figure covers ages 16 to 29, compared with 90% of all people (Eurostat).
- Americans under 30 are online almost constantly. 63% of adults aged 18 to 29 say so, versus 54% of those 30 to 49, 33% of those 50 to 64, and 14% of those 65 and older (Pew Research Center, 2026).
- UK adults aged 18 to 24 spend 6 hours 20 minutes online a day. Adults 65 and older spend 3 hours 20 minutes (Ofcom Online Nation, 2025).
- Newsletter news use is flat across age groups. It is 28% for ages 18 to 29, 31% for 30 to 49, 32% for 50 to 64, and 31% for 65 and over (Pew Research Center, 2026).
- Marketers target Millennials most. In 2024, 72% targeted Millennials, 41% Gen X, 36% Gen Z (up from 34%), and 19% Boomers (down from 27%) (HubSpot State of Marketing).
Email marketing vs. social media marketing statistics
- Social media has more accounts, email has more reach among some groups. There were 5.79 billion social media user identities in April 2026 (DataReportal), against a forecast 4.73 billion email users in 2026 (Radicati Group). “Identities” are not unique people, so the two aren’t like-for-like.
- 94.7% of internet users use social media each month. The average user visits 6.5 platforms (DataReportal, April 2026).
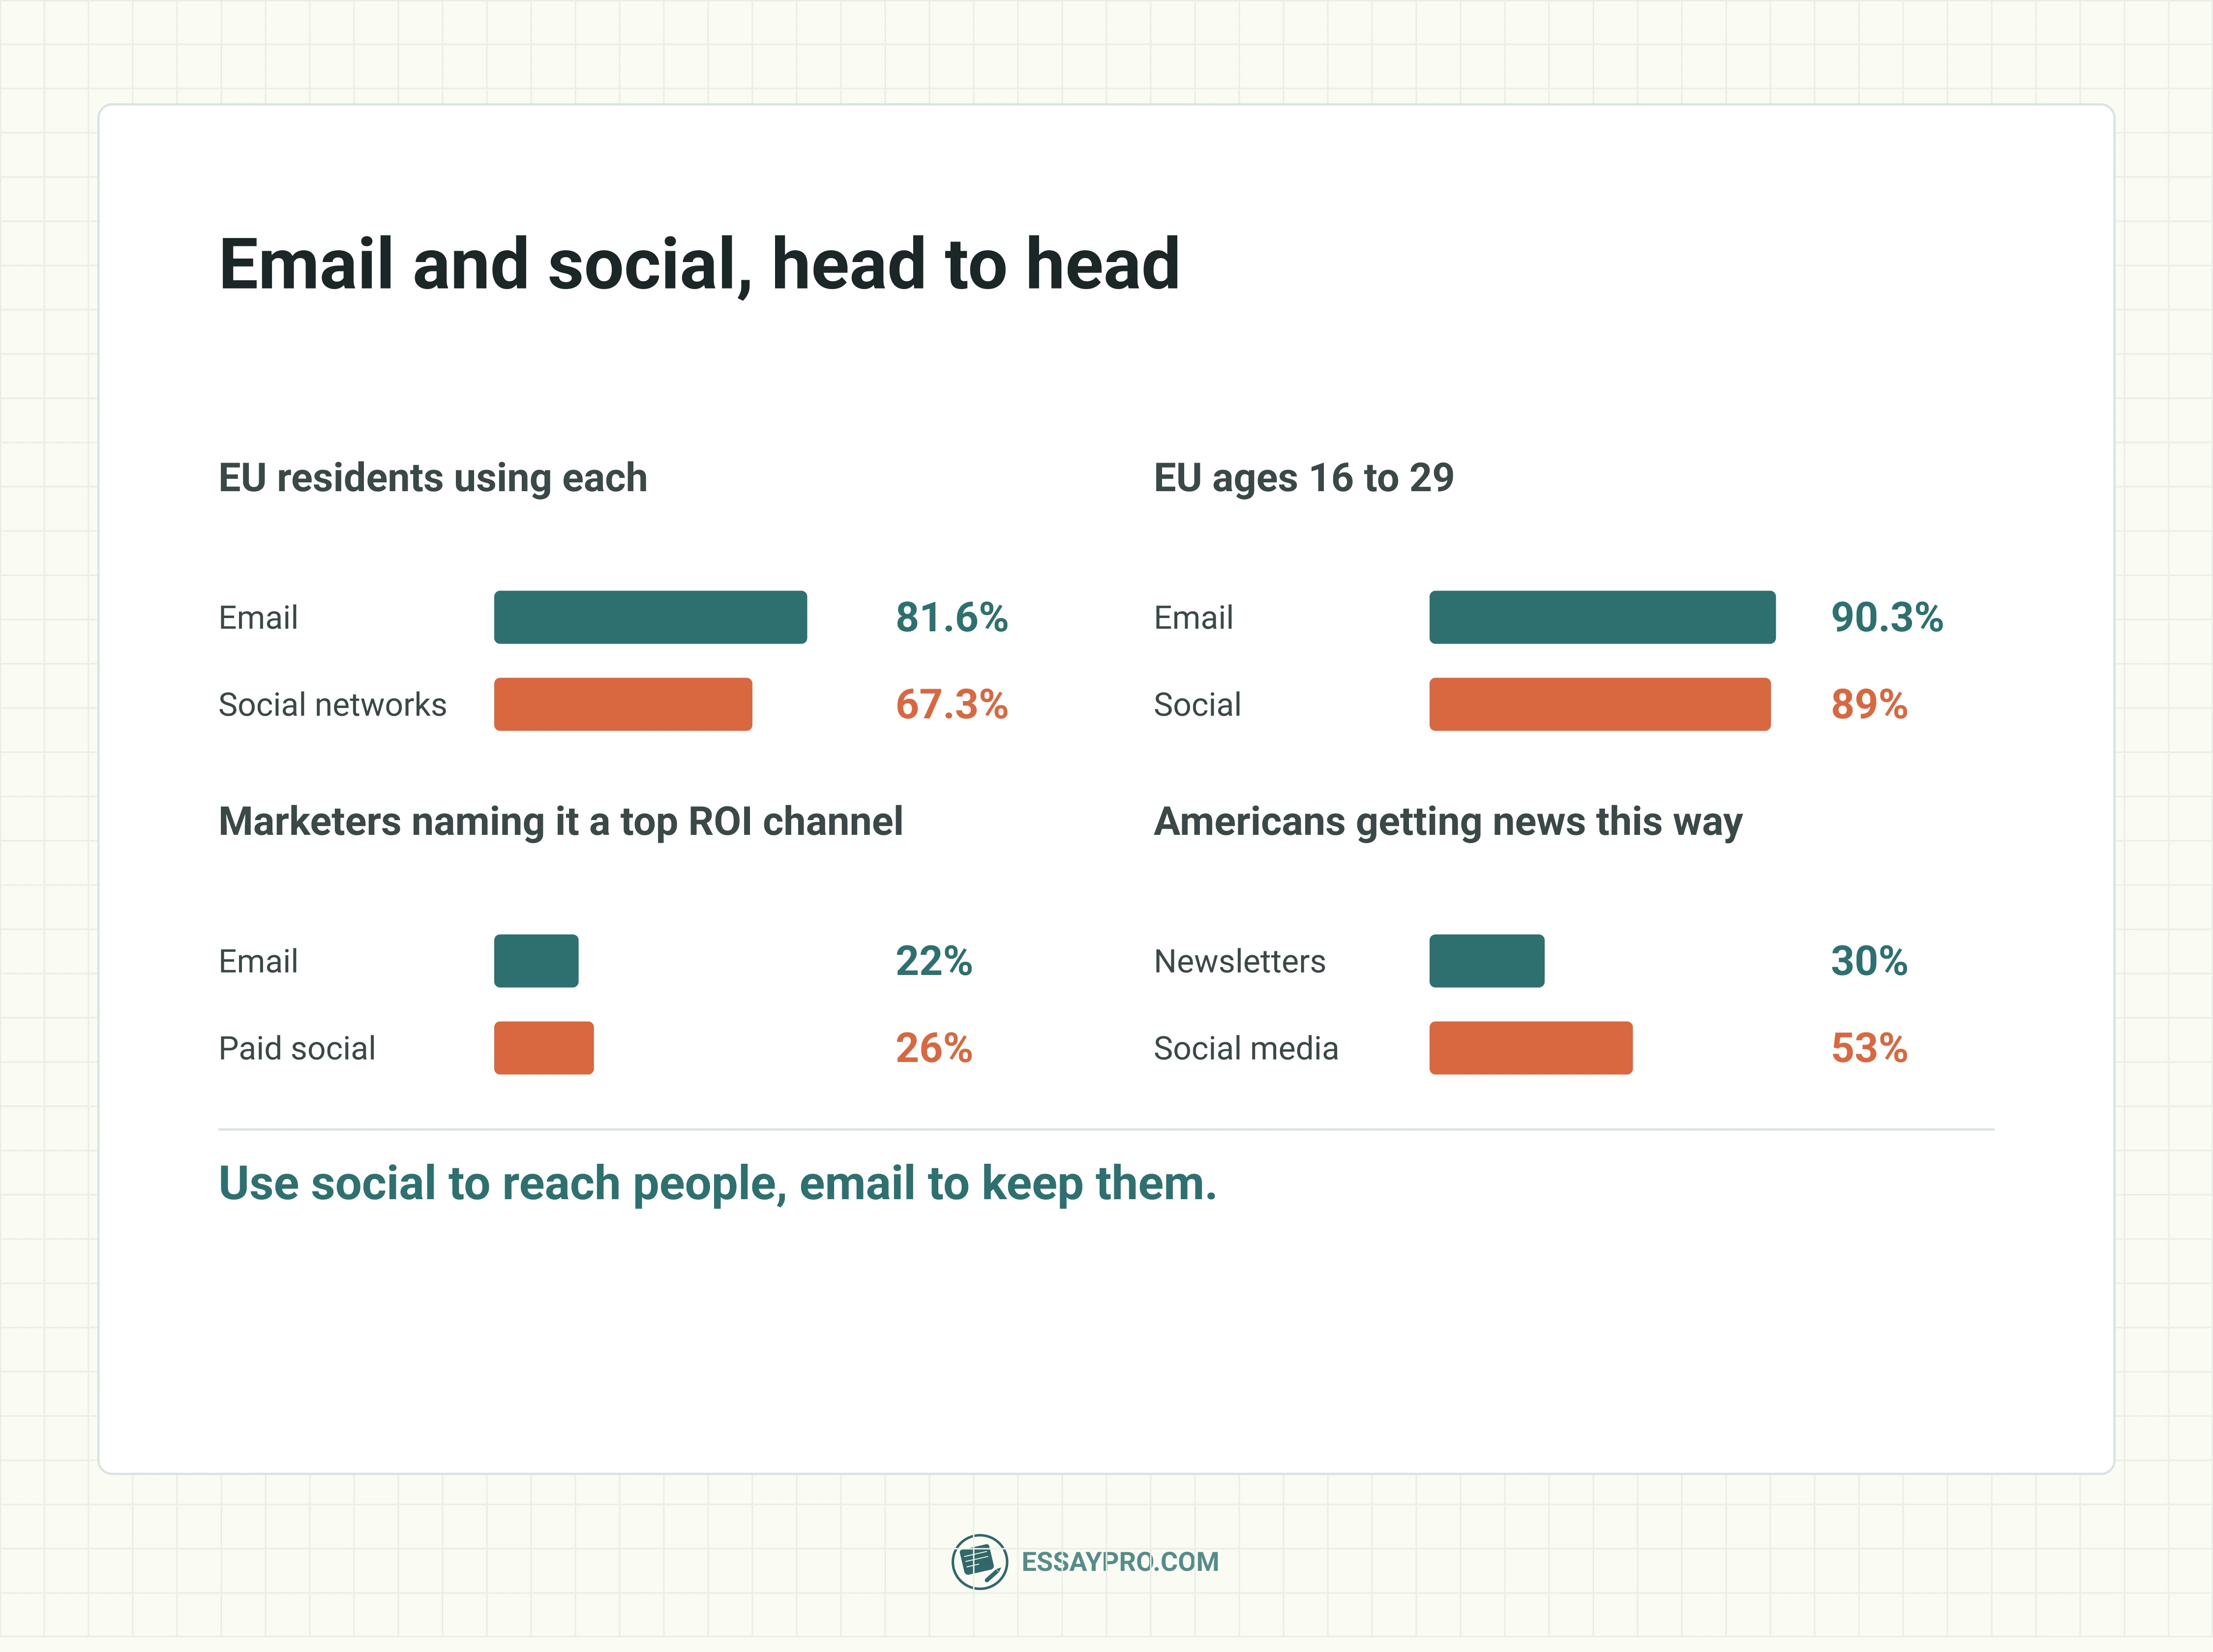
- In the EU, email beats social networks. 81.6% of people aged 16 to 74 used email in 2025, versus 67.3% for social networks (Eurostat).
- Among young EU adults, they’re nearly equal. 90.3% of 16- to 29-year-olds used email in 2025, and 89% used social networks (Eurostat).
- Americans use a handful of platforms widely. YouTube reaches 84% of US adults, Facebook 71%, Instagram 50%, and TikTok 37% (Pew Research Center, 2025).
- More Americans get news from social media than from newsletters. 53% do so often or sometimes from social media and 30% from email newsletters, but only 3% prefer newsletters, against 14% for social media (Pew Research Center, 2026).
- Marketers see email as the base of a channel sequence. The DMA’s UK survey describes “email first, social for complementary reach, phone for high-touch escalation,” and email takes about a fifth of marketing budgets (DMA Marketer Email Tracker, 2026).
- Email and organic social tie as the second most used channel. 40% of marketers use each (HubSpot State of Marketing, 2026).
- On ROI, paid social edges email in HubSpot’s 2026 survey. 26% of marketers name paid social among their top ROI channels, against 22% for email, with website, blog, and SEO first at 27% (HubSpot State of Marketing, 2026).
- For B2C brands in 2024, email ranked first for ROI. Paid social and content marketing followed. For B2B, website, blog, and SEO led, then paid social and social shopping tools (HubSpot State of Marketing, 2025).
- Marketers rate email and paid social equally for personalization. 26% call each one of the most effective channels for segmentation and personalization (HubSpot State of Marketing, 2026).
- Instagram and Facebook are the social platforms marketers use most. 70% use Instagram, 69.6% Facebook, 57% TikTok, and 42% LinkedIn (HubSpot State of Marketing, 2026).
- Social outreach got more replies than email in sales. Response rates were 42% versus 26% (HubSpot sales report, 2025).
- Social media is where most UK online harm happens. 59% of UK adults who met potential harms said their latest encounter was on social media, against 8% on email (Ofcom Online Nation, 2025).
Wrap up & insights
Email has always been a powerful form of marketing and will continue to be. With billions of consumers using it and all demographics reading from it, it's going to stick around with budgets alongside other marketing tactics. Here are some key lessons we can learn from this article's statistics.
- Clicks and action are what you should be looking at, not open rates. Open rates can no longer be trusted because of new privacy policies.
- We should be sending more personalized emails to our customers. Many companies still aren't utilizing segmentation to their fullest potential.
- Not everyone is using a computer; they may need larger font sizes or be reading their email on mobile. Design matters.
Technology will change how email marketing operates, but these basics should never be lost.
FAQ

What are abandoned cart emails, and why are they important?
How can I improve the open rates of my review request emails?
What is B2B email marketing?
What is a good click-through rate (CTR) for B2B email campaigns?
How effective is B2B email marketing?
What is B2C Email Marketing?
How to start with B2C email marketing?
What are some best practices for B2C email marketing?
What is mobile email marketing?
How can I optimize my emails for mobile devices?
What are email open rates?
What is the average email open rate across industries?
How soon do most recipients open emails after delivery?
How many email accounts does an average user have?
How does email usage differ across age groups?
How frequently do people check their email inboxes?
What is email segmentation?
What is generational marketing in email campaigns?
How do Baby Boomers respond to email marketing?
What are the key characteristics of Gen X and their email preferences?
What email preferences do Gen Zs have?
What is the difference between email marketing and social media marketing?
Which is more effective: email marketing or social media marketing?

Annie Lambert
specializes in creating authoritative content on marketing, business, and finance, with a versatile ability to handle any essay type and dissertations. With a Master’s degree in Business Administration and a passion for social issues, her writing not only educates but also inspires action. On EssayPro blog, Annie delivers detailed guides and thought-provoking discussions on pressing economic and social topics. When not writing, she’s a guest speaker at various business seminars.